

2007 National Roadside Survey of Alcohol and Drug Use by Drivers
2007 National Roadside Survey of Alcohol and Drug Use by Drivers
2007 National Roadside Survey of Alcohol and Drug Use by Drivers

You also want an ePaper? Increase the reach of your titles
YUMPU automatically turns print PDFs into web optimized ePapers that Google loves.
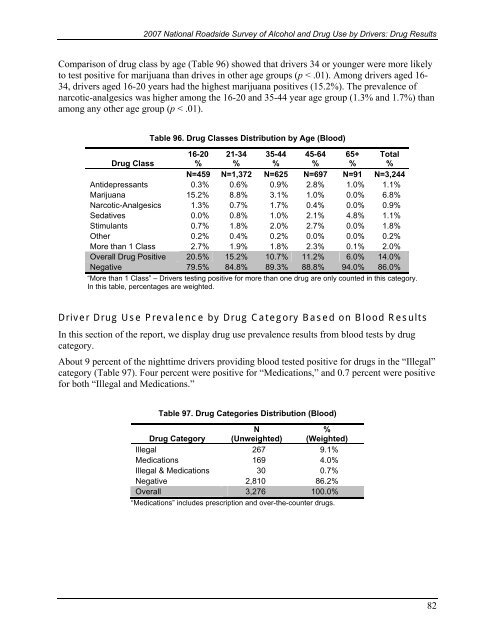
<strong>2007</strong> <strong>National</strong> <strong>Roadside</strong> <strong>Survey</strong> <strong>of</strong> <strong>Alcohol</strong> <strong>and</strong> <strong>Drug</strong> <strong>Use</strong> <strong>by</strong> <strong>Drivers</strong>: <strong>Drug</strong> ResultsComparison <strong>of</strong> drug class <strong>by</strong> age (Table 96) showed that drivers 34 or younger were more likelyto test positive for marijuana than drives in other age groups (p < .01). Among drivers aged 16-34, drivers aged 16-20 years had the highest marijuana positives (15.2%). The prevalence <strong>of</strong>narcotic-analgesics was higher among the 16-20 <strong>and</strong> 35-44 year age group (1.3% <strong>and</strong> 1.7%) thanamong any other age group (p < .01).Table 96. <strong>Drug</strong> Classes Distribution <strong>by</strong> Age (Blood)<strong>Drug</strong> Class16-20%21-34%35-44%45-64%65+%Total%N=459 N=1,372 N=625 N=697 N=91 N=3,244Antidepressants 0.3% 0.6% 0.9% 2.8% 1.0% 1.1%Marijuana 15.2% 8.8% 3.1% 1.0% 0.0% 6.8%Narcotic-Analgesics 1.3% 0.7% 1.7% 0.4% 0.0% 0.9%Sedatives 0.0% 0.8% 1.0% 2.1% 4.8% 1.1%Stimulants 0.7% 1.8% 2.0% 2.7% 0.0% 1.8%Other 0.2% 0.4% 0.2% 0.0% 0.0% 0.2%More than 1 Class 2.7% 1.9% 1.8% 2.3% 0.1% 2.0%Overall <strong>Drug</strong> Positive 20.5% 15.2% 10.7% 11.2% 6.0% 14.0%Negative 79.5% 84.8% 89.3% 88.8% 94.0% 86.0%“More than 1 Class” – <strong>Drivers</strong> testing positive for more than one drug are only counted in this category.In this table, percentages are weighted.Driver <strong>Drug</strong> <strong>Use</strong> Prevalence <strong>by</strong> <strong>Drug</strong> Category Based on Blood ResultsIn this section <strong>of</strong> the report, we display drug use prevalence results from blood tests <strong>by</strong> drugcategory.About 9 percent <strong>of</strong> the nighttime drivers providing blood tested positive for drugs in the “Illegal”category (Table 97). Four percent were positive for “Medications,” <strong>and</strong> 0.7 percent were positivefor both “Illegal <strong>and</strong> Medications.”Table 97. <strong>Drug</strong> Categories Distribution (Blood)<strong>Drug</strong> CategoryN(Unweighted)%(Weighted)Illegal 267 9.1%Medications 169 4.0%Illegal & Medications 30 0.7%Negative 2,810 86.2%Overall 3,276 100.0%“Medications” includes prescription <strong>and</strong> over-the-counter drugs.82

