

2007 National Roadside Survey of Alcohol and Drug Use by Drivers
2007 National Roadside Survey of Alcohol and Drug Use by Drivers
2007 National Roadside Survey of Alcohol and Drug Use by Drivers

Create successful ePaper yourself
Turn your PDF publications into a flip-book with our unique Google optimized e-Paper software.
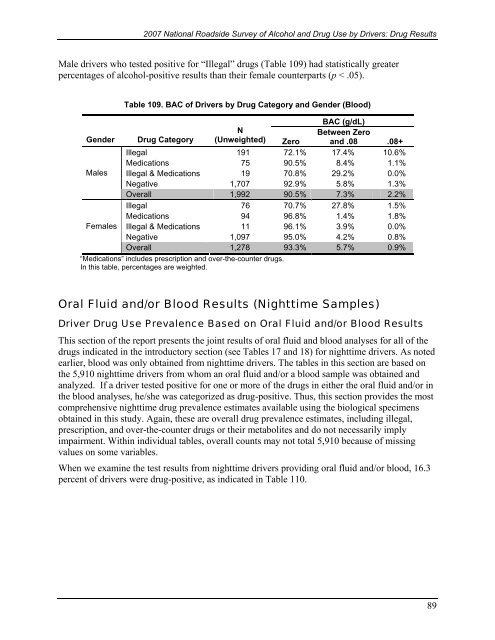
<strong>2007</strong> <strong>National</strong> <strong>Roadside</strong> <strong>Survey</strong> <strong>of</strong> <strong>Alcohol</strong> <strong>and</strong> <strong>Drug</strong> <strong>Use</strong> <strong>by</strong> <strong>Drivers</strong>: <strong>Drug</strong> ResultsMale drivers who tested positive for “Illegal” drugs (Table 109) had statistically greaterpercentages <strong>of</strong> alcohol-positive results than their female counterparts (p < .05).GenderMalesFemalesTable 109. BAC <strong>of</strong> <strong>Drivers</strong> <strong>by</strong> <strong>Drug</strong> Category <strong>and</strong> Gender (Blood)BAC (g/dL)<strong>Drug</strong> CategoryNBetween Zero(Unweighted) Zero <strong>and</strong> .08 .08+Illegal 191 72.1% 17.4% 10.6%Medications 75 90.5% 8.4% 1.1%Illegal & Medications 19 70.8% 29.2% 0.0%Negative 1,707 92.9% 5.8% 1.3%Overall 1,992 90.5% 7.3% 2.2%Illegal 76 70.7% 27.8% 1.5%Medications 94 96.8% 1.4% 1.8%Illegal & Medications 11 96.1% 3.9% 0.0%Negative 1,097 95.0% 4.2% 0.8%Overall 1,278 93.3% 5.7% 0.9%“Medications” includes prescription <strong>and</strong> over-the-counter drugs.In this table, percentages are weighted.Oral Fluid <strong>and</strong>/or Blood Results (Nighttime Samples)Driver <strong>Drug</strong> <strong>Use</strong> Prevalence Based on Oral Fluid <strong>and</strong>/or Blood ResultsThis section <strong>of</strong> the report presents the joint results <strong>of</strong> oral fluid <strong>and</strong> blood analyses for all <strong>of</strong> thedrugs indicated in the introductory section (see Tables 17 <strong>and</strong> 18) for nighttime drivers. As notedearlier, blood was only obtained from nighttime drivers. The tables in this section are based onthe 5,910 nighttime drivers from whom an oral fluid <strong>and</strong>/or a blood sample was obtained <strong>and</strong>analyzed. If a driver tested positive for one or more <strong>of</strong> the drugs in either the oral fluid <strong>and</strong>/or inthe blood analyses, he/she was categorized as drug-positive. Thus, this section provides the mostcomprehensive nighttime drug prevalence estimates available using the biological specimensobtained in this study. Again, these are overall drug prevalence estimates, including illegal,prescription, <strong>and</strong> over-the-counter drugs or their metabolites <strong>and</strong> do not necessarily implyimpairment. Within individual tables, overall counts may not total 5,910 because <strong>of</strong> missingvalues on some variables.When we examine the test results from nighttime drivers providing oral fluid <strong>and</strong>/or blood, 16.3percent <strong>of</strong> drivers were drug-positive, as indicated in Table 110.89

