

2007 National Roadside Survey of Alcohol and Drug Use by Drivers
2007 National Roadside Survey of Alcohol and Drug Use by Drivers
2007 National Roadside Survey of Alcohol and Drug Use by Drivers

Create successful ePaper yourself
Turn your PDF publications into a flip-book with our unique Google optimized e-Paper software.
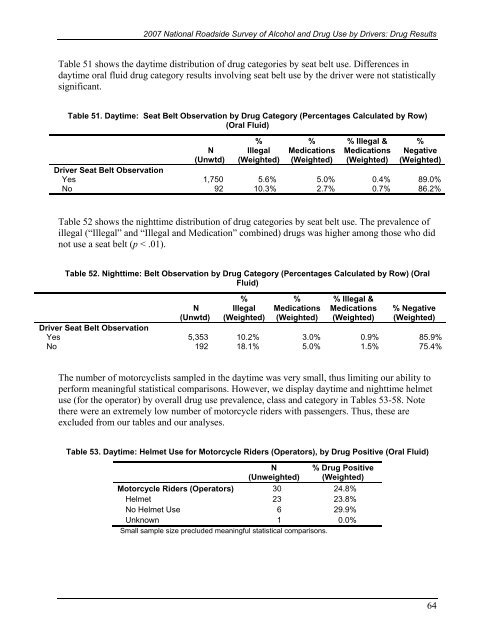
<strong>2007</strong> <strong>National</strong> <strong>Roadside</strong> <strong>Survey</strong> <strong>of</strong> <strong>Alcohol</strong> <strong>and</strong> <strong>Drug</strong> <strong>Use</strong> <strong>by</strong> <strong>Drivers</strong>: <strong>Drug</strong> ResultsTable 51 shows the daytime distribution <strong>of</strong> drug categories <strong>by</strong> seat belt use. Differences indaytime oral fluid drug category results involving seat belt use <strong>by</strong> the driver were not statisticallysignificant.Table 51. Daytime: Seat Belt Observation <strong>by</strong> <strong>Drug</strong> Category (Percentages Calculated <strong>by</strong> Row)(Oral Fluid)N(Unwtd)%Illegal(Weighted)%Medications(Weighted)% Illegal &Medications(Weighted)%Negative(Weighted)Driver Seat Belt ObservationYes 1,750 5.6% 5.0% 0.4% 89.0%No 92 10.3% 2.7% 0.7% 86.2%Table 52 shows the nighttime distribution <strong>of</strong> drug categories <strong>by</strong> seat belt use. The prevalence <strong>of</strong>illegal (“Illegal” <strong>and</strong> “Illegal <strong>and</strong> Medication” combined) drugs was higher among those who didnot use a seat belt (p < .01).Table 52. Nighttime: Belt Observation <strong>by</strong> <strong>Drug</strong> Category (Percentages Calculated <strong>by</strong> Row) (OralFluid)N(Unwtd)%Illegal(Weighted)%Medications(Weighted)% Illegal &Medications(Weighted)% Negative(Weighted)Driver Seat Belt ObservationYes 5,353 10.2% 3.0% 0.9% 85.9%No 192 18.1% 5.0% 1.5% 75.4%The number <strong>of</strong> motorcyclists sampled in the daytime was very small, thus limiting our ability toperform meaningful statistical comparisons. However, we display daytime <strong>and</strong> nighttime helmetuse (for the operator) <strong>by</strong> overall drug use prevalence, class <strong>and</strong> category in Tables 53-58. Notethere were an extremely low number <strong>of</strong> motorcycle riders with passengers. Thus, these areexcluded from our tables <strong>and</strong> our analyses.Table 53. Daytime: Helmet <strong>Use</strong> for Motorcycle Riders (Operators), <strong>by</strong> <strong>Drug</strong> Positive (Oral Fluid)N(Unweighted)% <strong>Drug</strong> Positive(Weighted)Motorcycle Riders (Operators) 30 24.8%Helmet 23 23.8%No Helmet <strong>Use</strong> 6 29.9%Unknown 1 0.0%Small sample size precluded meaningful statistical comparisons.64

