

2007 National Roadside Survey of Alcohol and Drug Use by Drivers
2007 National Roadside Survey of Alcohol and Drug Use by Drivers
2007 National Roadside Survey of Alcohol and Drug Use by Drivers

Create successful ePaper yourself
Turn your PDF publications into a flip-book with our unique Google optimized e-Paper software.
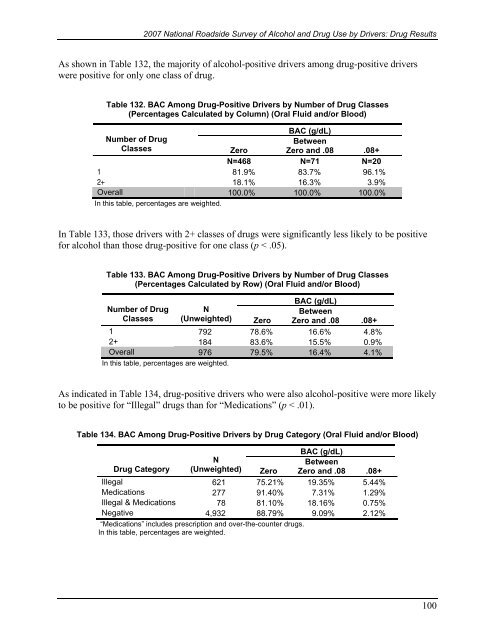
<strong>2007</strong> <strong>National</strong> <strong>Roadside</strong> <strong>Survey</strong> <strong>of</strong> <strong>Alcohol</strong> <strong>and</strong> <strong>Drug</strong> <strong>Use</strong> <strong>by</strong> <strong>Drivers</strong>: <strong>Drug</strong> ResultsAs shown in Table 132, the majority <strong>of</strong> alcohol-positive drivers among drug-positive driverswere positive for only one class <strong>of</strong> drug.Table 132. BAC Among <strong>Drug</strong>-Positive <strong>Drivers</strong> <strong>by</strong> Number <strong>of</strong> <strong>Drug</strong> Classes(Percentages Calculated <strong>by</strong> Column) (Oral Fluid <strong>and</strong>/or Blood)BAC (g/dL)Number <strong>of</strong> <strong>Drug</strong>BetweenClassesZero Zero <strong>and</strong> .08 .08+N=468 N=71 N=201 81.9% 83.7% 96.1%2+ 18.1% 16.3% 3.9%Overall 100.0% 100.0% 100.0%In this table, percentages are weighted.In Table 133, those drivers with 2+ classes <strong>of</strong> drugs were significantly less likely to be positivefor alcohol than those drug-positive for one class (p < .05).Table 133. BAC Among <strong>Drug</strong>-Positive <strong>Drivers</strong> <strong>by</strong> Number <strong>of</strong> <strong>Drug</strong> Classes(Percentages Calculated <strong>by</strong> Row) (Oral Fluid <strong>and</strong>/or Blood)BAC (g/dL)Number <strong>of</strong> <strong>Drug</strong> NBetweenClasses (Unweighted) Zero Zero <strong>and</strong> .08 .08+1 792 78.6% 16.6% 4.8%2+ 184 83.6% 15.5% 0.9%Overall 976 79.5% 16.4% 4.1%In this table, percentages are weighted.As indicated in Table 134, drug-positive drivers who were also alcohol-positive were more likelyto be positive for “Illegal” drugs than for “Medications” (p < .01).Table 134. BAC Among <strong>Drug</strong>-Positive <strong>Drivers</strong> <strong>by</strong> <strong>Drug</strong> Category (Oral Fluid <strong>and</strong>/or Blood)BAC (g/dL)<strong>Drug</strong> CategoryNBetween(Unweighted) Zero Zero <strong>and</strong> .08 .08+Illegal 621 75.21% 19.35% 5.44%Medications 277 91.40% 7.31% 1.29%Illegal & Medications 78 81.10% 18.16% 0.75%Negative 4,932 88.79% 9.09% 2.12%“Medications” includes prescription <strong>and</strong> over-the-counter drugs.In this table, percentages are weighted.100

