

2007 National Roadside Survey of Alcohol and Drug Use by Drivers
2007 National Roadside Survey of Alcohol and Drug Use by Drivers
2007 National Roadside Survey of Alcohol and Drug Use by Drivers

You also want an ePaper? Increase the reach of your titles
YUMPU automatically turns print PDFs into web optimized ePapers that Google loves.
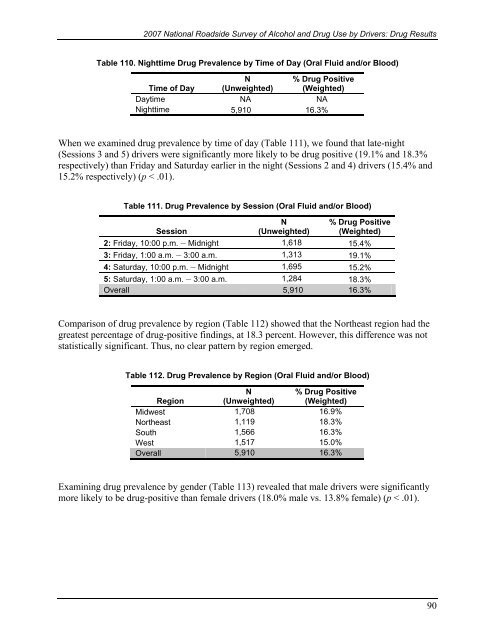
<strong>2007</strong> <strong>National</strong> <strong>Roadside</strong> <strong>Survey</strong> <strong>of</strong> <strong>Alcohol</strong> <strong>and</strong> <strong>Drug</strong> <strong>Use</strong> <strong>by</strong> <strong>Drivers</strong>: <strong>Drug</strong> ResultsTable 110. Nighttime <strong>Drug</strong> Prevalence <strong>by</strong> Time <strong>of</strong> Day (Oral Fluid <strong>and</strong>/or Blood)Time <strong>of</strong> DayN(Unweighted)% <strong>Drug</strong> Positive(Weighted)Daytime NA NANighttime 5,910 16.3%When we examined drug prevalence <strong>by</strong> time <strong>of</strong> day (Table 111), we found that late-night(Sessions 3 <strong>and</strong> 5) drivers were significantly more likely to be drug positive (19.1% <strong>and</strong> 18.3%respectively) than Friday <strong>and</strong> Saturday earlier in the night (Sessions 2 <strong>and</strong> 4) drivers (15.4% <strong>and</strong>15.2% respectively) (p < .01).Table 111. <strong>Drug</strong> Prevalence <strong>by</strong> Session (Oral Fluid <strong>and</strong>/or Blood)SessionN(Unweighted)% <strong>Drug</strong> Positive(Weighted)2: Friday, 10:00 p.m. – Midnight 1,618 15.4%3: Friday, 1:00 a.m. – 3:00 a.m. 1,313 19.1%4: Saturday, 10:00 p.m. – Midnight 1,695 15.2%5: Saturday, 1:00 a.m. – 3:00 a.m. 1,284 18.3%Overall 5,910 16.3%Comparison <strong>of</strong> drug prevalence <strong>by</strong> region (Table 112) showed that the Northeast region had thegreatest percentage <strong>of</strong> drug-positive findings, at 18.3 percent. However, this difference was notstatistically significant. Thus, no clear pattern <strong>by</strong> region emerged.Table 112. <strong>Drug</strong> Prevalence <strong>by</strong> Region (Oral Fluid <strong>and</strong>/or Blood)RegionN(Unweighted)% <strong>Drug</strong> Positive(Weighted)Midwest 1,708 16.9%Northeast 1,119 18.3%South 1,566 16.3%West 1,517 15.0%Overall 5,910 16.3%Examining drug prevalence <strong>by</strong> gender (Table 113) revealed that male drivers were significantlymore likely to be drug-positive than female drivers (18.0% male vs. 13.8% female) (p < .01).90

