

2007 National Roadside Survey of Alcohol and Drug Use by Drivers
2007 National Roadside Survey of Alcohol and Drug Use by Drivers
2007 National Roadside Survey of Alcohol and Drug Use by Drivers

You also want an ePaper? Increase the reach of your titles
YUMPU automatically turns print PDFs into web optimized ePapers that Google loves.
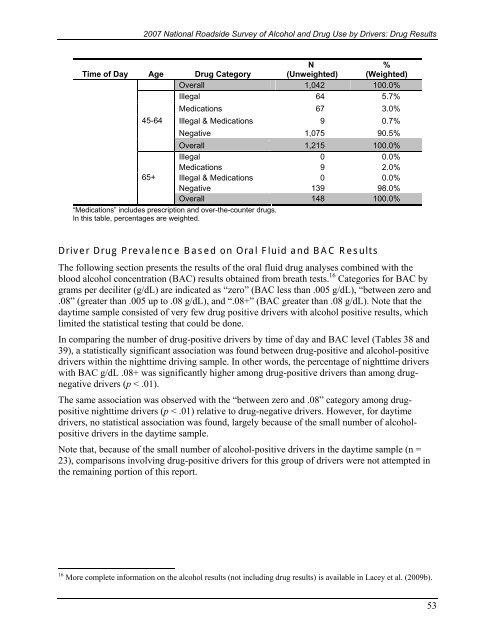
<strong>2007</strong> <strong>National</strong> <strong>Roadside</strong> <strong>Survey</strong> <strong>of</strong> <strong>Alcohol</strong> <strong>and</strong> <strong>Drug</strong> <strong>Use</strong> <strong>by</strong> <strong>Drivers</strong>: <strong>Drug</strong> ResultsTime <strong>of</strong> Day Age <strong>Drug</strong> CategoryN(Unweighted)%(Weighted)Overall 1,042 100.0%Illegal 64 5.7%45-6465+“Medications” includes prescription <strong>and</strong> over-the-counter drugs.In this table, percentages are weighted.Medications 67 3.0%Illegal & Medications 9 0.7%Negative 1,075 90.5%Overall 1,215 100.0%Illegal 0 0.0%Medications 9 2.0%Illegal & Medications 0 0.0%Negative 139 98.0%Overall 148 100.0%Driver <strong>Drug</strong> Prevalence Based on Oral Fluid <strong>and</strong> BAC ResultsThe following section presents the results <strong>of</strong> the oral fluid drug analyses combined with theblood alcohol concentration (BAC) results obtained from breath tests. 16 Categories for BAC <strong>by</strong>grams per deciliter (g/dL) are indicated as “zero” (BAC less than .005 g/dL), “between zero <strong>and</strong>.08” (greater than .005 up to .08 g/dL), <strong>and</strong> “.08+” (BAC greater than .08 g/dL). Note that thedaytime sample consisted <strong>of</strong> very few drug positive drivers with alcohol positive results, whichlimited the statistical testing that could be done.In comparing the number <strong>of</strong> drug-positive drivers <strong>by</strong> time <strong>of</strong> day <strong>and</strong> BAC level (Tables 38 <strong>and</strong>39), a statistically significant association was found between drug-positive <strong>and</strong> alcohol-positivedrivers within the nighttime driving sample. In other words, the percentage <strong>of</strong> nighttime driverswith BAC g/dL .08+ was significantly higher among drug-positive drivers than among drugnegativedrivers (p < .01).The same association was observed with the “between zero <strong>and</strong> .08” category among drugpositivenighttime drivers (p < .01) relative to drug-negative drivers. However, for daytimedrivers, no statistical association was found, largely because <strong>of</strong> the small number <strong>of</strong> alcoholpositivedrivers in the daytime sample.Note that, because <strong>of</strong> the small number <strong>of</strong> alcohol-positive drivers in the daytime sample (n =23), comparisons involving drug-positive drivers for this group <strong>of</strong> drivers were not attempted inthe remaining portion <strong>of</strong> this report.16 More complete information on the alcohol results (not including drug results) is available in Lacey et al. (2009b).53

