

2007 National Roadside Survey of Alcohol and Drug Use by Drivers
2007 National Roadside Survey of Alcohol and Drug Use by Drivers
2007 National Roadside Survey of Alcohol and Drug Use by Drivers

Create successful ePaper yourself
Turn your PDF publications into a flip-book with our unique Google optimized e-Paper software.
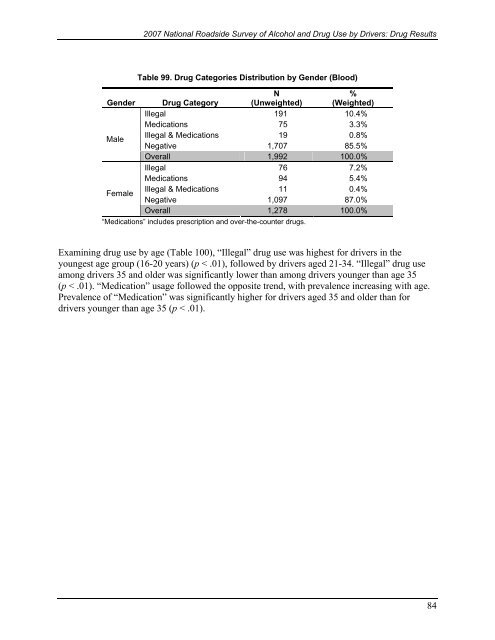
<strong>2007</strong> <strong>National</strong> <strong>Roadside</strong> <strong>Survey</strong> <strong>of</strong> <strong>Alcohol</strong> <strong>and</strong> <strong>Drug</strong> <strong>Use</strong> <strong>by</strong> <strong>Drivers</strong>: <strong>Drug</strong> ResultsGenderMaleFemaleTable 99. <strong>Drug</strong> Categories Distribution <strong>by</strong> Gender (Blood)<strong>Drug</strong> CategoryN(Unweighted)%(Weighted)Illegal 191 10.4%Medications 75 3.3%Illegal & Medications 19 0.8%Negative 1,707 85.5%Overall 1,992 100.0%Illegal 76 7.2%Medications 94 5.4%Illegal & Medications 11 0.4%Negative 1,097 87.0%Overall 1,278 100.0%“Medications” includes prescription <strong>and</strong> over-the-counter drugs.Examining drug use <strong>by</strong> age (Table 100), “Illegal” drug use was highest for drivers in theyoungest age group (16-20 years) (p < .01), followed <strong>by</strong> drivers aged 21-34. “Illegal” drug useamong drivers 35 <strong>and</strong> older was significantly lower than among drivers younger than age 35(p < .01). “Medication” usage followed the opposite trend, with prevalence increasing with age.Prevalence <strong>of</strong> “Medication” was significantly higher for drivers aged 35 <strong>and</strong> older than fordrivers younger than age 35 (p < .01).84

