

2007 National Roadside Survey of Alcohol and Drug Use by Drivers
2007 National Roadside Survey of Alcohol and Drug Use by Drivers
2007 National Roadside Survey of Alcohol and Drug Use by Drivers

Create successful ePaper yourself
Turn your PDF publications into a flip-book with our unique Google optimized e-Paper software.
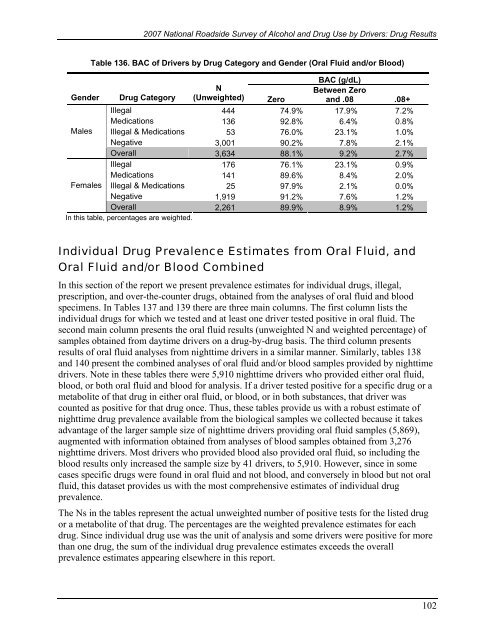
<strong>2007</strong> <strong>National</strong> <strong>Roadside</strong> <strong>Survey</strong> <strong>of</strong> <strong>Alcohol</strong> <strong>and</strong> <strong>Drug</strong> <strong>Use</strong> <strong>by</strong> <strong>Drivers</strong>: <strong>Drug</strong> ResultsTable 136. BAC <strong>of</strong> <strong>Drivers</strong> <strong>by</strong> <strong>Drug</strong> Category <strong>and</strong> Gender (Oral Fluid <strong>and</strong>/or Blood)BAC (g/dL)Gender <strong>Drug</strong> CategoryNBetween Zero(Unweighted) Zero<strong>and</strong> .08 .08+Illegal 444 74.9% 17.9% 7.2%Medications 136 92.8% 6.4% 0.8%Males Illegal & Medications 53 76.0% 23.1% 1.0%Negative 3,001 90.2% 7.8% 2.1%Overall 3,634 88.1% 9.2% 2.7%Illegal 176 76.1% 23.1% 0.9%Medications 141 89.6% 8.4% 2.0%Females Illegal & Medications 25 97.9% 2.1% 0.0%Negative 1,919 91.2% 7.6% 1.2%Overall 2,261 89.9% 8.9% 1.2%In this table, percentages are weighted.Individual <strong>Drug</strong> Prevalence Estimates from Oral Fluid, <strong>and</strong>Oral Fluid <strong>and</strong>/or Blood CombinedIn this section <strong>of</strong> the report we present prevalence estimates for individual drugs, illegal,prescription, <strong>and</strong> over-the-counter drugs, obtained from the analyses <strong>of</strong> oral fluid <strong>and</strong> bloodspecimens. In Tables 137 <strong>and</strong> 139 there are three main columns. The first column lists theindividual drugs for which we tested <strong>and</strong> at least one driver tested positive in oral fluid. Thesecond main column presents the oral fluid results (unweighted N <strong>and</strong> weighted percentage) <strong>of</strong>samples obtained from daytime drivers on a drug-<strong>by</strong>-drug basis. The third column presentsresults <strong>of</strong> oral fluid analyses from nighttime drivers in a similar manner. Similarly, tables 138<strong>and</strong> 140 present the combined analyses <strong>of</strong> oral fluid <strong>and</strong>/or blood samples provided <strong>by</strong> nighttimedrivers. Note in these tables there were 5,910 nighttime drivers who provided either oral fluid,blood, or both oral fluid <strong>and</strong> blood for analysis. If a driver tested positive for a specific drug or ametabolite <strong>of</strong> that drug in either oral fluid, or blood, or in both substances, that driver wascounted as positive for that drug once. Thus, these tables provide us with a robust estimate <strong>of</strong>nighttime drug prevalence available from the biological samples we collected because it takesadvantage <strong>of</strong> the larger sample size <strong>of</strong> nighttime drivers providing oral fluid samples (5,869),augmented with information obtained from analyses <strong>of</strong> blood samples obtained from 3,276nighttime drivers. Most drivers who provided blood also provided oral fluid, so including theblood results only increased the sample size <strong>by</strong> 41 drivers, to 5,910. However, since in somecases specific drugs were found in oral fluid <strong>and</strong> not blood, <strong>and</strong> conversely in blood but not oralfluid, this dataset provides us with the most comprehensive estimates <strong>of</strong> individual drugprevalence.The Ns in the tables represent the actual unweighted number <strong>of</strong> positive tests for the listed drugor a metabolite <strong>of</strong> that drug. The percentages are the weighted prevalence estimates for eachdrug. Since individual drug use was the unit <strong>of</strong> analysis <strong>and</strong> some drivers were positive for morethan one drug, the sum <strong>of</strong> the individual drug prevalence estimates exceeds the overallprevalence estimates appearing elsewhere in this report.102

