

2007 National Roadside Survey of Alcohol and Drug Use by Drivers
2007 National Roadside Survey of Alcohol and Drug Use by Drivers
2007 National Roadside Survey of Alcohol and Drug Use by Drivers

You also want an ePaper? Increase the reach of your titles
YUMPU automatically turns print PDFs into web optimized ePapers that Google loves.
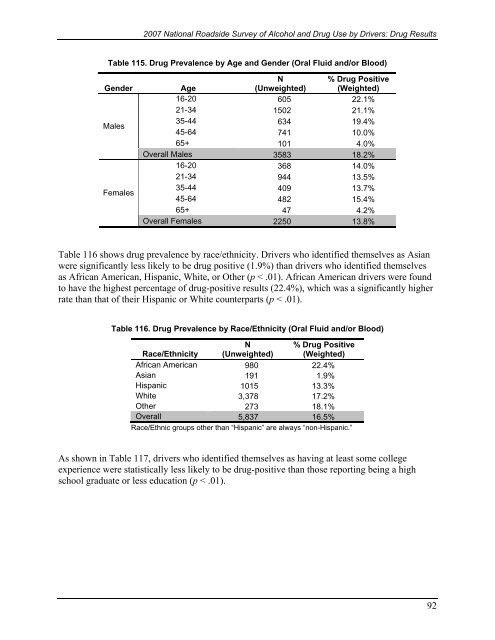
<strong>2007</strong> <strong>National</strong> <strong>Roadside</strong> <strong>Survey</strong> <strong>of</strong> <strong>Alcohol</strong> <strong>and</strong> <strong>Drug</strong> <strong>Use</strong> <strong>by</strong> <strong>Drivers</strong>: <strong>Drug</strong> ResultsTable 115. <strong>Drug</strong> Prevalence <strong>by</strong> Age <strong>and</strong> Gender (Oral Fluid <strong>and</strong>/or Blood)GenderMalesFemalesAgeN(Unweighted)% <strong>Drug</strong> Positive(Weighted)16-20 605 22.1%21-34 1502 21.1%35-44 634 19.4%45-64 741 10.0%65+ 101 4.0%Overall Males 3583 18.2%16-20 368 14.0%21-34 944 13.5%35-44 409 13.7%45-64 482 15.4%65+ 47 4.2%Overall Females 2250 13.8%Table 116 shows drug prevalence <strong>by</strong> race/ethnicity. <strong>Drivers</strong> who identified themselves as Asianwere significantly less likely to be drug positive (1.9%) than drivers who identified themselvesas African American, Hispanic, White, or Other (p < .01). African American drivers were foundto have the highest percentage <strong>of</strong> drug-positive results (22.4%), which was a significantly higherrate than that <strong>of</strong> their Hispanic or White counterparts (p < .01).Table 116. <strong>Drug</strong> Prevalence <strong>by</strong> Race/Ethnicity (Oral Fluid <strong>and</strong>/or Blood)Race/EthnicityN(Unweighted)% <strong>Drug</strong> Positive(Weighted)African American 980 22.4%Asian 191 1.9%Hispanic 1015 13.3%White 3,378 17.2%Other 273 18.1%Overall 5,837 16.5%Race/Ethnic groups other than “Hispanic” are always “non-Hispanic.”As shown in Table 117, drivers who identified themselves as having at least some collegeexperience were statistically less likely to be drug-positive than those reporting being a highschool graduate or less education (p < .01).92

