

2007 National Roadside Survey of Alcohol and Drug Use by Drivers
2007 National Roadside Survey of Alcohol and Drug Use by Drivers
2007 National Roadside Survey of Alcohol and Drug Use by Drivers

You also want an ePaper? Increase the reach of your titles
YUMPU automatically turns print PDFs into web optimized ePapers that Google loves.
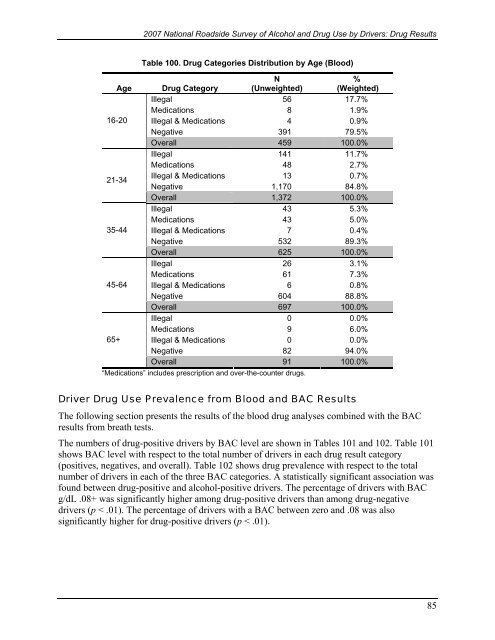
<strong>2007</strong> <strong>National</strong> <strong>Roadside</strong> <strong>Survey</strong> <strong>of</strong> <strong>Alcohol</strong> <strong>and</strong> <strong>Drug</strong> <strong>Use</strong> <strong>by</strong> <strong>Drivers</strong>: <strong>Drug</strong> ResultsAge16-2021-3435-4445-6465+Table 100. <strong>Drug</strong> Categories Distribution <strong>by</strong> Age (Blood)<strong>Drug</strong> CategoryN(Unweighted)%(Weighted)Illegal 56 17.7%Medications 8 1.9%Illegal & Medications 4 0.9%Negative 391 79.5%Overall 459 100.0%Illegal 141 11.7%Medications 48 2.7%Illegal & Medications 13 0.7%Negative 1,170 84.8%Overall 1,372 100.0%Illegal 43 5.3%Medications 43 5.0%Illegal & Medications 7 0.4%Negative 532 89.3%Overall 625 100.0%Illegal 26 3.1%Medications 61 7.3%Illegal & Medications 6 0.8%Negative 604 88.8%Overall 697 100.0%Illegal 0 0.0%Medications 9 6.0%Illegal & Medications 0 0.0%Negative 82 94.0%Overall 91 100.0%“Medications” includes prescription <strong>and</strong> over-the-counter drugs.Driver <strong>Drug</strong> <strong>Use</strong> Prevalence from Blood <strong>and</strong> BAC ResultsThe following section presents the results <strong>of</strong> the blood drug analyses combined with the BACresults from breath tests.The numbers <strong>of</strong> drug-positive drivers <strong>by</strong> BAC level are shown in Tables 101 <strong>and</strong> 102. Table 101shows BAC level with respect to the total number <strong>of</strong> drivers in each drug result category(positives, negatives, <strong>and</strong> overall). Table 102 shows drug prevalence with respect to the totalnumber <strong>of</strong> drivers in each <strong>of</strong> the three BAC categories. A statistically significant association wasfound between drug-positive <strong>and</strong> alcohol-positive drivers. The percentage <strong>of</strong> drivers with BACg/dL .08+ was significantly higher among drug-positive drivers than among drug-negativedrivers (p < .01). The percentage <strong>of</strong> drivers with a BAC between zero <strong>and</strong> .08 was alsosignificantly higher for drug-positive drivers (p < .01).85

