<strong>2007</strong> <strong>National</strong> <strong>Roadside</strong> <strong>Survey</strong> <strong>of</strong> <strong>Alcohol</strong> <strong>and</strong> <strong>Drug</strong> <strong>Use</strong> <strong>by</strong> <strong>Drivers</strong>: <strong>Drug</strong> Resultsdrug consumption; (5) questions about interaction with the criminal justice system <strong>and</strong> thetreatment system; <strong>and</strong> (6) collection <strong>of</strong> information on passengers.In all four NRS studies, police <strong>of</strong>ficers directed vehicles to a safe location, where an interviewerapproached the driver <strong>and</strong> requested participation in a survey followed <strong>by</strong> a breath test. R<strong>and</strong>omselection <strong>of</strong> drivers was insured <strong>by</strong> selecting the next vehicle when an interviewer becameavailable. Any driver suspected <strong>of</strong> impairment was subjected to a safety protocol designed todissuade his/her continued driving on that trip. See the Methodology Report for details (Lacey etal., 2009a).As noted above, the original 1973 survey used a four-stage sampling plan, <strong>and</strong> the 1986 NRSattempted to replicate the 1973 locations. In the 1996 <strong>and</strong> <strong>2007</strong> surveys, the first stage was takenfrom the NHTSA’s <strong>National</strong> Automotive Sampling System/Crashworthiness Data System(NASS/CDS, 1995). The second stage involved the selection <strong>of</strong> police jurisdictions within theNASS/CDS primary sampling units. The third stage <strong>of</strong> the sampling design involved theselection <strong>of</strong> survey sites within police jurisdictions, <strong>and</strong> the fourth stage consisted <strong>of</strong> selectingdrivers at r<strong>and</strong>om from the traffic flow at these sites. Details regarding the sampling plan can befound in the Methodology Report (Lacey et al., 2009a).New to the <strong>2007</strong> survey was the collection <strong>of</strong> additional types <strong>of</strong> biological samples (oral fluid<strong>and</strong> blood) to determine the presence <strong>of</strong> drugs other than alcohol in the driving population. Oralfluid <strong>and</strong> blood samples were analyzed in a laboratory using enzyme-linked immunosorbentassay (ELISA) screening, followed <strong>by</strong> a confirmatory analysis <strong>by</strong> Liquid Chromatography-T<strong>and</strong>em Mass Spectrometry (LC/MS-MS) or Gas Chromatography/Mass Spectrometry(GC/MS). This <strong>2007</strong> NRS is more extensive than any previous NRS study <strong>and</strong> provides a muchbroader perspective on alcohol <strong>and</strong> drug use in the driving population than previously available.These data are essential to developing more precise estimates <strong>of</strong> the presence <strong>of</strong> alcohol <strong>and</strong>other drugs in drivers, <strong>and</strong> in measuring the prevalence <strong>of</strong> alcohol- <strong>and</strong> drug-involved driving.This report summarizes the drug-involved driving prevalence estimates obtained throughanalyses <strong>of</strong> oral fluid <strong>and</strong> blood specimen results, <strong>and</strong> combined with alcohol using breathalcohol measurements. It should be emphasized that prevalence estimates do not necessarilyimply “impairment,” but rather, in this case, the presence <strong>of</strong> drugs <strong>and</strong> alcohol in the driverpopulation. For many drug types, drug presence can be detected long after any impairment thatmight affect driving has passed. 2 Other studies are required to assess whether that presenceimplies an increased risk <strong>of</strong> crash involvement. In this study, we developed driver-prevalenceestimates for illegal, prescription, <strong>and</strong> over-the-counter drugs which were determined <strong>by</strong> a panel<strong>of</strong> experts to possibly cause impairment. It should be noted that prescription <strong>and</strong> over-the-counterdrugs can be used according to medical advice or extra-medicinally. Again, the prevalenceestimates indicate the presence <strong>of</strong> the drugs in drivers but do not necessarily indicate that thedrivers were impaired.2 For example, traces <strong>of</strong> marijuana can be detected in blood samples several weeks after chronic users stopingestion. Also, whereas the impairment effects for various concentration levels <strong>of</strong> alcohol is well understood, littleevidence is available to link concentrations <strong>of</strong> other drug types to driver performance.2
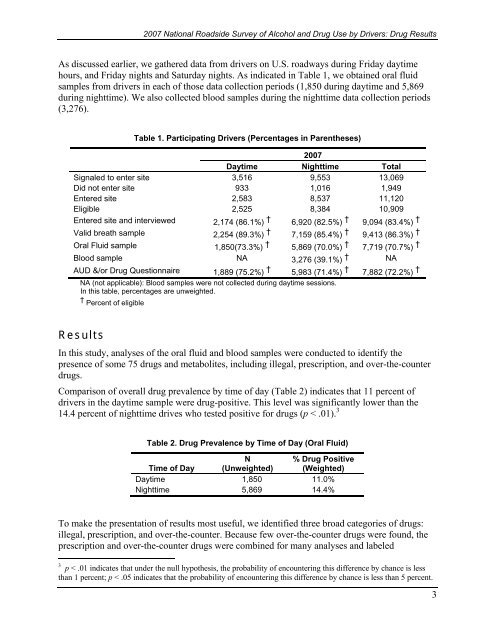
<strong>2007</strong> <strong>National</strong> <strong>Roadside</strong> <strong>Survey</strong> <strong>of</strong> <strong>Alcohol</strong> <strong>and</strong> <strong>Drug</strong> <strong>Use</strong> <strong>by</strong> <strong>Drivers</strong>: <strong>Drug</strong> ResultsAs discussed earlier, we gathered data from drivers on U.S. roadways during Friday daytimehours, <strong>and</strong> Friday nights <strong>and</strong> Saturday nights. As indicated in Table 1, we obtained oral fluidsamples from drivers in each <strong>of</strong> those data collection periods (1,850 during daytime <strong>and</strong> 5,869during nighttime). We also collected blood samples during the nighttime data collection periods(3,276).Table 1. Participating <strong>Drivers</strong> (Percentages in Parentheses)<strong>2007</strong>Daytime Nighttime TotalSignaled to enter site 3,516 9,553 13,069Did not enter site 933 1,016 1,949Entered site 2,583 8,537 11,120Eligible 2,525 8,384 10,909Entered site <strong>and</strong> interviewed 2,174 (86.1%) † 6,920 (82.5%) † 9,094 (83.4%) †Valid breath sample 2,254 (89.3%) † 7,159 (85.4%) † 9,413 (86.3%) †Oral Fluid sample 1,850(73.3%) † 5,869 (70.0%) † 7,719 (70.7%) †Blood sample NA 3,276 (39.1%) † NAAUD &/or <strong>Drug</strong> Questionnaire 1,889 (75.2%) † 5,983 (71.4%) † 7,882 (72.2%) †NA (not applicable): Blood samples were not collected during daytime sessions.In this table, percentages are unweighted.† Percent <strong>of</strong> eligibleResultsIn this study, analyses <strong>of</strong> the oral fluid <strong>and</strong> blood samples were conducted to identify thepresence <strong>of</strong> some 75 drugs <strong>and</strong> metabolites, including illegal, prescription, <strong>and</strong> over-the-counterdrugs.Comparison <strong>of</strong> overall drug prevalence <strong>by</strong> time <strong>of</strong> day (Table 2) indicates that 11 percent <strong>of</strong>drivers in the daytime sample were drug-positive. This level was significantly lower than the14.4 percent <strong>of</strong> nighttime drives who tested positive for drugs (p < .01). 3Table 2. <strong>Drug</strong> Prevalence <strong>by</strong> Time <strong>of</strong> Day (Oral Fluid)Time <strong>of</strong> DayN(Unweighted)% <strong>Drug</strong> Positive(Weighted)Daytime 1,850 11.0%Nighttime 5,869 14.4%To make the presentation <strong>of</strong> results most useful, we identified three broad categories <strong>of</strong> drugs:illegal, prescription, <strong>and</strong> over-the-counter. Because few over-the-counter drugs were found, theprescription <strong>and</strong> over-the-counter drugs were combined for many analyses <strong>and</strong> labeled3 p < .01 indicates that under the null hypothesis, the probability <strong>of</strong> encountering this difference <strong>by</strong> chance is lessthan 1 percent; p < .05 indicates that the probability <strong>of</strong> encountering this difference <strong>by</strong> chance is less than 5 percent.3