

2007 National Roadside Survey of Alcohol and Drug Use by Drivers
2007 National Roadside Survey of Alcohol and Drug Use by Drivers
2007 National Roadside Survey of Alcohol and Drug Use by Drivers

You also want an ePaper? Increase the reach of your titles
YUMPU automatically turns print PDFs into web optimized ePapers that Google loves.
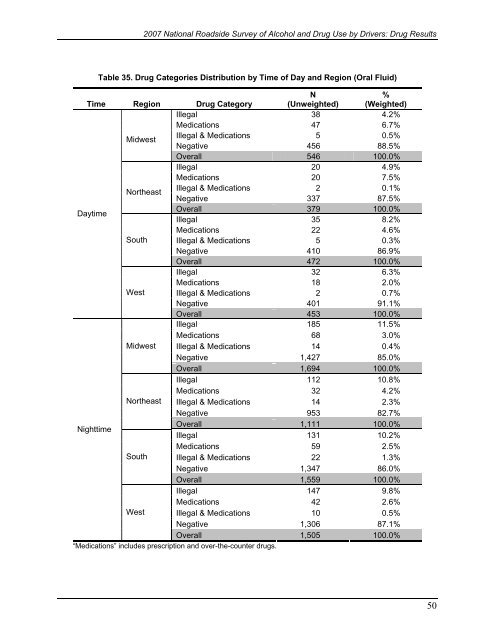
<strong>2007</strong> <strong>National</strong> <strong>Roadside</strong> <strong>Survey</strong> <strong>of</strong> <strong>Alcohol</strong> <strong>and</strong> <strong>Drug</strong> <strong>Use</strong> <strong>by</strong> <strong>Drivers</strong>: <strong>Drug</strong> ResultsTable 35. <strong>Drug</strong> Categories Distribution <strong>by</strong> Time <strong>of</strong> Day <strong>and</strong> Region (Oral Fluid)Time Region <strong>Drug</strong> CategoryN(Unweighted)%(Weighted)Illegal 38 4.2%Medications 47 6.7%MidwestIllegal & Medications 5 0.5%Negative 456 88.5%Overall 546 100.0%Illegal 20 4.9%Medications 20 7.5%NortheastIllegal & Medications 2 0.1%Negative 337 87.5%DaytimeOverall 379 100.0%Illegal 35 8.2%Medications 22 4.6%South Illegal & Medications 5 0.3%Negative 410 86.9%Overall 472 100.0%Illegal 32 6.3%Medications 18 2.0%West Illegal & Medications 2 0.7%Negative 401 91.1%Overall 453 100.0%Illegal 185 11.5%Medications 68 3.0%Midwest Illegal & Medications 14 0.4%Negative 1,427 85.0%Overall 1,694 100.0%Illegal 112 10.8%Medications 32 4.2%Northeast Illegal & Medications 14 2.3%Negative 953 82.7%NighttimeOverall 1,111 100.0%Illegal 131 10.2%Medications 59 2.5%South Illegal & Medications 22 1.3%Negative 1,347 86.0%Overall 1,559 100.0%Illegal 147 9.8%Medications 42 2.6%West Illegal & Medications 10 0.5%Negative 1,306 87.1%Overall 1,505 100.0%“Medications” includes prescription <strong>and</strong> over-the-counter drugs.50

