

2007 National Roadside Survey of Alcohol and Drug Use by Drivers
2007 National Roadside Survey of Alcohol and Drug Use by Drivers
2007 National Roadside Survey of Alcohol and Drug Use by Drivers

Create successful ePaper yourself
Turn your PDF publications into a flip-book with our unique Google optimized e-Paper software.
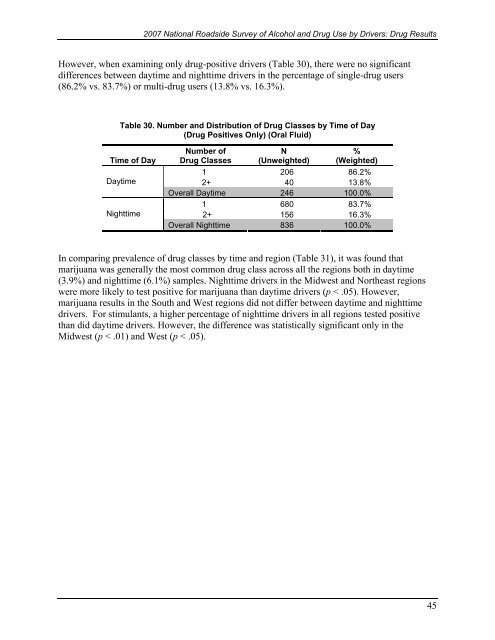
<strong>2007</strong> <strong>National</strong> <strong>Roadside</strong> <strong>Survey</strong> <strong>of</strong> <strong>Alcohol</strong> <strong>and</strong> <strong>Drug</strong> <strong>Use</strong> <strong>by</strong> <strong>Drivers</strong>: <strong>Drug</strong> ResultsHowever, when examining only drug-positive drivers (Table 30), there were no significantdifferences between daytime <strong>and</strong> nighttime drivers in the percentage <strong>of</strong> single-drug users(86.2% vs. 83.7%) or multi-drug users (13.8% vs. 16.3%).Table 30. Number <strong>and</strong> Distribution <strong>of</strong> <strong>Drug</strong> Classes <strong>by</strong> Time <strong>of</strong> Day(<strong>Drug</strong> Positives Only) (Oral Fluid)Time <strong>of</strong> DayDaytimeNighttimeNumber <strong>of</strong><strong>Drug</strong> ClassesN(Unweighted)%(Weighted)1 206 86.2%2+ 40 13.8%Overall Daytime 246 100.0%1 680 83.7%2+ 156 16.3%Overall Nighttime 836 100.0%In comparing prevalence <strong>of</strong> drug classes <strong>by</strong> time <strong>and</strong> region (Table 31), it was found thatmarijuana was generally the most common drug class across all the regions both in daytime(3.9%) <strong>and</strong> nighttime (6.1%) samples. Nighttime drivers in the Midwest <strong>and</strong> Northeast regionswere more likely to test positive for marijuana than daytime drivers (p < .05). However,marijuana results in the South <strong>and</strong> West regions did not differ between daytime <strong>and</strong> nighttimedrivers. For stimulants, a higher percentage <strong>of</strong> nighttime drivers in all regions tested positivethan did daytime drivers. However, the difference was statistically significant only in theMidwest (p < .01) <strong>and</strong> West (p < .05).45

