2007 National Roadside Survey of Alcohol and Drug Use by Drivers
2007 National Roadside Survey of Alcohol and Drug Use by Drivers
2007 National Roadside Survey of Alcohol and Drug Use by Drivers
You also want an ePaper? Increase the reach of your titles
YUMPU automatically turns print PDFs into web optimized ePapers that Google loves.
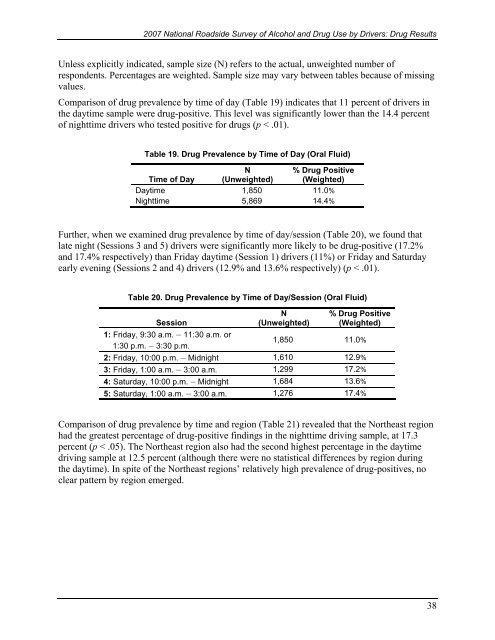
<strong>2007</strong> <strong>National</strong> <strong>Roadside</strong> <strong>Survey</strong> <strong>of</strong> <strong>Alcohol</strong> <strong>and</strong> <strong>Drug</strong> <strong>Use</strong> <strong>by</strong> <strong>Drivers</strong>: <strong>Drug</strong> ResultsUnless explicitly indicated, sample size (N) refers to the actual, unweighted number <strong>of</strong>respondents. Percentages are weighted. Sample size may vary between tables because <strong>of</strong> missingvalues.Comparison <strong>of</strong> drug prevalence <strong>by</strong> time <strong>of</strong> day (Table 19) indicates that 11 percent <strong>of</strong> drivers inthe daytime sample were drug-positive. This level was significantly lower than the 14.4 percent<strong>of</strong> nighttime drivers who tested positive for drugs (p < .01).Table 19. <strong>Drug</strong> Prevalence <strong>by</strong> Time <strong>of</strong> Day (Oral Fluid)Time <strong>of</strong> DayN(Unweighted)% <strong>Drug</strong> Positive(Weighted)Daytime 1,850 11.0%Nighttime 5,869 14.4%Further, when we examined drug prevalence <strong>by</strong> time <strong>of</strong> day/session (Table 20), we found thatlate night (Sessions 3 <strong>and</strong> 5) drivers were significantly more likely to be drug-positive (17.2%<strong>and</strong> 17.4% respectively) than Friday daytime (Session 1) drivers (11%) or Friday <strong>and</strong> Saturdayearly evening (Sessions 2 <strong>and</strong> 4) drivers (12.9% <strong>and</strong> 13.6% respectively) (p < .01).Table 20. <strong>Drug</strong> Prevalence <strong>by</strong> Time <strong>of</strong> Day/Session (Oral Fluid)SessionN(Unweighted)% <strong>Drug</strong> Positive(Weighted)1: Friday, 9:30 a.m. – 11:30 a.m. or1:30 p.m. – 3:30 p.m.1,850 11.0%2: Friday, 10:00 p.m. – Midnight 1,610 12.9%3: Friday, 1:00 a.m. – 3:00 a.m. 1,299 17.2%4: Saturday, 10:00 p.m. – Midnight 1,684 13.6%5: Saturday, 1:00 a.m. – 3:00 a.m. 1,276 17.4%Comparison <strong>of</strong> drug prevalence <strong>by</strong> time <strong>and</strong> region (Table 21) revealed that the Northeast regionhad the greatest percentage <strong>of</strong> drug-positive findings in the nighttime driving sample, at 17.3percent (p < .05). The Northeast region also had the second highest percentage in the daytimedriving sample at 12.5 percent (although there were no statistical differences <strong>by</strong> region duringthe daytime). In spite <strong>of</strong> the Northeast regions’ relatively high prevalence <strong>of</strong> drug-positives, noclear pattern <strong>by</strong> region emerged.38


