2007 National Roadside Survey of Alcohol and Drug Use by Drivers
2007 National Roadside Survey of Alcohol and Drug Use by Drivers
2007 National Roadside Survey of Alcohol and Drug Use by Drivers
You also want an ePaper? Increase the reach of your titles
YUMPU automatically turns print PDFs into web optimized ePapers that Google loves.
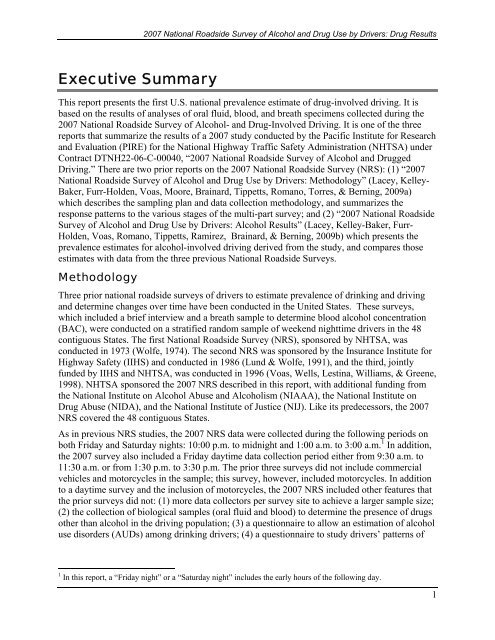
<strong>2007</strong> <strong>National</strong> <strong>Roadside</strong> <strong>Survey</strong> <strong>of</strong> <strong>Alcohol</strong> <strong>and</strong> <strong>Drug</strong> <strong>Use</strong> <strong>by</strong> <strong>Drivers</strong>: <strong>Drug</strong> ResultsExecutive SummaryThis report presents the first U.S. national prevalence estimate <strong>of</strong> drug-involved driving. It isbased on the results <strong>of</strong> analyses <strong>of</strong> oral fluid, blood, <strong>and</strong> breath specimens collected during the<strong>2007</strong> <strong>National</strong> <strong>Roadside</strong> <strong>Survey</strong> <strong>of</strong> <strong>Alcohol</strong>- <strong>and</strong> <strong>Drug</strong>-Involved Driving. It is one <strong>of</strong> the threereports that summarize the results <strong>of</strong> a <strong>2007</strong> study conducted <strong>by</strong> the Pacific Institute for Research<strong>and</strong> Evaluation (PIRE) for the <strong>National</strong> Highway Traffic Safety Administration (NHTSA) underContract DTNH22-06-C-00040, “<strong>2007</strong> <strong>National</strong> <strong>Roadside</strong> <strong>Survey</strong> <strong>of</strong> <strong>Alcohol</strong> <strong>and</strong> <strong>Drug</strong>gedDriving.” There are two prior reports on the <strong>2007</strong> <strong>National</strong> <strong>Roadside</strong> <strong>Survey</strong> (NRS): (1) “<strong>2007</strong><strong>National</strong> <strong>Roadside</strong> <strong>Survey</strong> <strong>of</strong> <strong>Alcohol</strong> <strong>and</strong> <strong>Drug</strong> <strong>Use</strong> <strong>by</strong> <strong>Drivers</strong>: Methodology” (Lacey, Kelley-Baker, Furr-Holden, Voas, Moore, Brainard, Tippetts, Romano, Torres, & Berning, 2009a)which describes the sampling plan <strong>and</strong> data collection methodology, <strong>and</strong> summarizes theresponse patterns to the various stages <strong>of</strong> the multi-part survey; <strong>and</strong> (2) “<strong>2007</strong> <strong>National</strong> <strong>Roadside</strong><strong>Survey</strong> <strong>of</strong> <strong>Alcohol</strong> <strong>and</strong> <strong>Drug</strong> <strong>Use</strong> <strong>by</strong> <strong>Drivers</strong>: <strong>Alcohol</strong> Results” (Lacey, Kelley-Baker, Furr-Holden, Voas, Romano, Tippetts, Ramirez, Brainard, & Berning, 2009b) which presents theprevalence estimates for alcohol-involved driving derived from the study, <strong>and</strong> compares thoseestimates with data from the three previous <strong>National</strong> <strong>Roadside</strong> <strong>Survey</strong>s.MethodologyThree prior national roadside surveys <strong>of</strong> drivers to estimate prevalence <strong>of</strong> drinking <strong>and</strong> driving<strong>and</strong> determine changes over time have been conducted in the United States. These surveys,which included a brief interview <strong>and</strong> a breath sample to determine blood alcohol concentration(BAC), were conducted on a stratified r<strong>and</strong>om sample <strong>of</strong> weekend nighttime drivers in the 48contiguous States. The first <strong>National</strong> <strong>Roadside</strong> <strong>Survey</strong> (NRS), sponsored <strong>by</strong> NHTSA, wasconducted in 1973 (Wolfe, 1974). The second NRS was sponsored <strong>by</strong> the Insurance Institute forHighway Safety (IIHS) <strong>and</strong> conducted in 1986 (Lund & Wolfe, 1991), <strong>and</strong> the third, jointlyfunded <strong>by</strong> IIHS <strong>and</strong> NHTSA, was conducted in 1996 (Voas, Wells, Lestina, Williams, & Greene,1998). NHTSA sponsored the <strong>2007</strong> NRS described in this report, with additional funding fromthe <strong>National</strong> Institute on <strong>Alcohol</strong> Abuse <strong>and</strong> <strong>Alcohol</strong>ism (NIAAA), the <strong>National</strong> Institute on<strong>Drug</strong> Abuse (NIDA), <strong>and</strong> the <strong>National</strong> Institute <strong>of</strong> Justice (NIJ). Like its predecessors, the <strong>2007</strong>NRS covered the 48 contiguous States.As in previous NRS studies, the <strong>2007</strong> NRS data were collected during the following periods onboth Friday <strong>and</strong> Saturday nights: 10:00 p.m. to midnight <strong>and</strong> 1:00 a.m. to 3:00 a.m. 1 In addition,the <strong>2007</strong> survey also included a Friday daytime data collection period either from 9:30 a.m. to11:30 a.m. or from 1:30 p.m. to 3:30 p.m. The prior three surveys did not include commercialvehicles <strong>and</strong> motorcycles in the sample; this survey, however, included motorcycles. In additionto a daytime survey <strong>and</strong> the inclusion <strong>of</strong> motorcycles, the <strong>2007</strong> NRS included other features thatthe prior surveys did not: (1) more data collectors per survey site to achieve a larger sample size;(2) the collection <strong>of</strong> biological samples (oral fluid <strong>and</strong> blood) to determine the presence <strong>of</strong> drugsother than alcohol in the driving population; (3) a questionnaire to allow an estimation <strong>of</strong> alcoholuse disorders (AUDs) among drinking drivers; (4) a questionnaire to study drivers’ patterns <strong>of</strong>1 In this report, a “Friday night” or a “Saturday night” includes the early hours <strong>of</strong> the following day.1


