

2007 National Roadside Survey of Alcohol and Drug Use by Drivers
2007 National Roadside Survey of Alcohol and Drug Use by Drivers
2007 National Roadside Survey of Alcohol and Drug Use by Drivers

You also want an ePaper? Increase the reach of your titles
YUMPU automatically turns print PDFs into web optimized ePapers that Google loves.
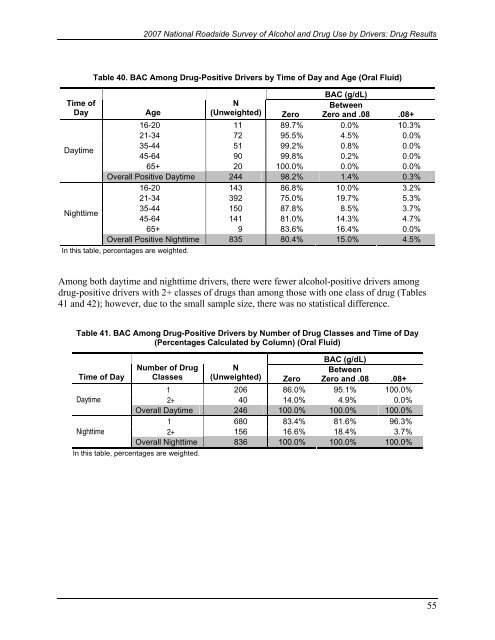
<strong>2007</strong> <strong>National</strong> <strong>Roadside</strong> <strong>Survey</strong> <strong>of</strong> <strong>Alcohol</strong> <strong>and</strong> <strong>Drug</strong> <strong>Use</strong> <strong>by</strong> <strong>Drivers</strong>: <strong>Drug</strong> ResultsTime <strong>of</strong>DayDaytimeNighttimeTable 40. BAC Among <strong>Drug</strong>-Positive <strong>Drivers</strong> <strong>by</strong> Time <strong>of</strong> Day <strong>and</strong> Age (Oral Fluid)BAC (g/dL)AgeNBetween(Unweighted) Zero Zero <strong>and</strong> .08 .08+16-20 11 89.7% 0.0% 10.3%21-34 72 95.5% 4.5% 0.0%35-44 51 99.2% 0.8% 0.0%45-64 90 99.8% 0.2% 0.0%65+ 20 100.0% 0.0% 0.0%Overall Positive Daytime 244 98.2% 1.4% 0.3%16-20 143 86.8% 10.0% 3.2%21-34 392 75.0% 19.7% 5.3%35-44 150 87.8% 8.5% 3.7%45-64 141 81.0% 14.3% 4.7%65+ 9 83.6% 16.4% 0.0%Overall Positive Nighttime 835 80.4% 15.0% 4.5%In this table, percentages are weighted.Among both daytime <strong>and</strong> nighttime drivers, there were fewer alcohol-positive drivers amongdrug-positive drivers with 2+ classes <strong>of</strong> drugs than among those with one class <strong>of</strong> drug (Tables41 <strong>and</strong> 42); however, due to the small sample size, there was no statistical difference.Table 41. BAC Among <strong>Drug</strong>-Positive <strong>Drivers</strong> <strong>by</strong> Number <strong>of</strong> <strong>Drug</strong> Classes <strong>and</strong> Time <strong>of</strong> Day(Percentages Calculated <strong>by</strong> Column) (Oral Fluid)BAC (g/dL)Time <strong>of</strong> DayNumber <strong>of</strong> <strong>Drug</strong> NBetweenClasses (Unweighted) Zero Zero <strong>and</strong> .08 .08+1 206 86.0% 95.1% 100.0%Daytime2+ 40 14.0% 4.9% 0.0%Overall Daytime 246 100.0% 100.0% 100.0%1 680 83.4% 81.6% 96.3%Nighttime2+ 156 16.6% 18.4% 3.7%Overall Nighttime 836 100.0% 100.0% 100.0%In this table, percentages are weighted.55

