

2007 National Roadside Survey of Alcohol and Drug Use by Drivers
2007 National Roadside Survey of Alcohol and Drug Use by Drivers
2007 National Roadside Survey of Alcohol and Drug Use by Drivers

You also want an ePaper? Increase the reach of your titles
YUMPU automatically turns print PDFs into web optimized ePapers that Google loves.
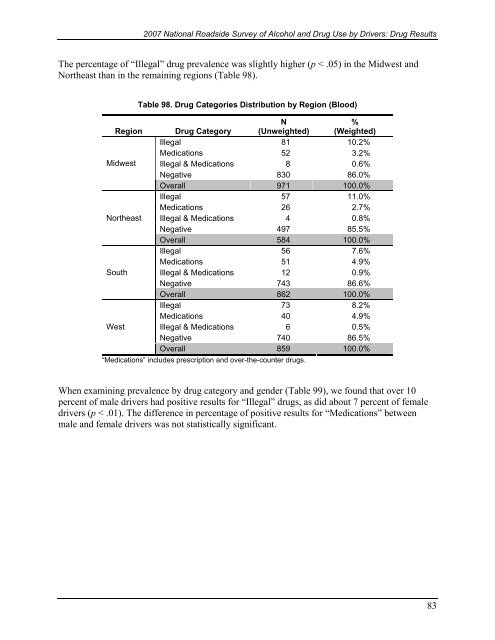
<strong>2007</strong> <strong>National</strong> <strong>Roadside</strong> <strong>Survey</strong> <strong>of</strong> <strong>Alcohol</strong> <strong>and</strong> <strong>Drug</strong> <strong>Use</strong> <strong>by</strong> <strong>Drivers</strong>: <strong>Drug</strong> ResultsThe percentage <strong>of</strong> “Illegal” drug prevalence was slightly higher (p < .05) in the Midwest <strong>and</strong>Northeast than in the remaining regions (Table 98).RegionMidwestNortheastSouthWestTable 98. <strong>Drug</strong> Categories Distribution <strong>by</strong> Region (Blood)<strong>Drug</strong> CategoryN(Unweighted)%(Weighted)Illegal 81 10.2%Medications 52 3.2%Illegal & Medications 8 0.6%Negative 830 86.0%Overall 971 100.0%Illegal 57 11.0%Medications 26 2.7%Illegal & Medications 4 0.8%Negative 497 85.5%Overall 584 100.0%Illegal 56 7.6%Medications 51 4.9%Illegal & Medications 12 0.9%Negative 743 86.6%Overall 862 100.0%Illegal 73 8.2%Medications 40 4.9%Illegal & Medications 6 0.5%Negative 740 86.5%Overall 859 100.0%“Medications” includes prescription <strong>and</strong> over-the-counter drugs.When examining prevalence <strong>by</strong> drug category <strong>and</strong> gender (Table 99), we found that over 10percent <strong>of</strong> male drivers had positive results for “Illegal” drugs, as did about 7 percent <strong>of</strong> femaledrivers (p < .01). The difference in percentage <strong>of</strong> positive results for “Medications” betweenmale <strong>and</strong> female drivers was not statistically significant.83

