

2007 National Roadside Survey of Alcohol and Drug Use by Drivers
2007 National Roadside Survey of Alcohol and Drug Use by Drivers
2007 National Roadside Survey of Alcohol and Drug Use by Drivers

Create successful ePaper yourself
Turn your PDF publications into a flip-book with our unique Google optimized e-Paper software.
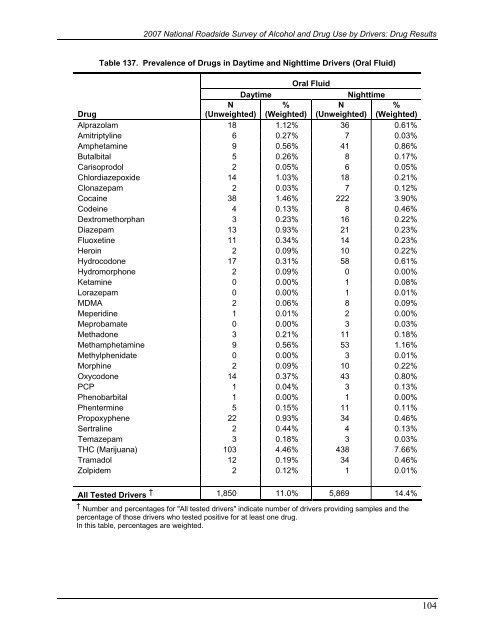
<strong>2007</strong> <strong>National</strong> <strong>Roadside</strong> <strong>Survey</strong> <strong>of</strong> <strong>Alcohol</strong> <strong>and</strong> <strong>Drug</strong> <strong>Use</strong> <strong>by</strong> <strong>Drivers</strong>: <strong>Drug</strong> ResultsTable 137. Prevalence <strong>of</strong> <strong>Drug</strong>s in Daytime <strong>and</strong> Nighttime <strong>Drivers</strong> (Oral Fluid)Oral FluidDaytimeNighttime<strong>Drug</strong>N(Unweighted)%(Weighted)N(Unweighted)%(Weighted)Alprazolam 18 1.12% 36 0.61%Amitriptyline 6 0.27% 7 0.03%Amphetamine 9 0.56% 41 0.86%Butalbital 5 0.26% 8 0.17%Carisoprodol 2 0.05% 6 0.05%Chlordiazepoxide 14 1.03% 18 0.21%Clonazepam 2 0.03% 7 0.12%Cocaine 38 1.46% 222 3.90%Codeine 4 0.13% 8 0.46%Dextromethorphan 3 0.23% 16 0.22%Diazepam 13 0.93% 21 0.23%Fluoxetine 11 0.34% 14 0.23%Heroin 2 0.09% 10 0.22%Hydrocodone 17 0.31% 58 0.61%Hydromorphone 2 0.09% 0 0.00%Ketamine 0 0.00% 1 0.08%Lorazepam 0 0.00% 1 0.01%MDMA 2 0.06% 8 0.09%Meperidine 1 0.01% 2 0.00%Meprobamate 0 0.00% 3 0.03%Methadone 3 0.21% 11 0.18%Methamphetamine 9 0.56% 53 1.16%Methylphenidate 0 0.00% 3 0.01%Morphine 2 0.09% 10 0.22%Oxycodone 14 0.37% 43 0.80%PCP 1 0.04% 3 0.13%Phenobarbital 1 0.00% 1 0.00%Phentermine 5 0.15% 11 0.11%Propoxyphene 22 0.93% 34 0.46%Sertraline 2 0.44% 4 0.13%Temazepam 3 0.18% 3 0.03%THC (Marijuana) 103 4.46% 438 7.66%Tramadol 12 0.19% 34 0.46%Zolpidem 2 0.12% 1 0.01%All Tested <strong>Drivers</strong> † 1,850 11.0% 5,869 14.4%† Number <strong>and</strong> percentages for "All tested drivers" indicate number <strong>of</strong> drivers providing samples <strong>and</strong> thepercentage <strong>of</strong> those drivers who tested positive for at least one drug.In this table, percentages are weighted.104

