

2007 National Roadside Survey of Alcohol and Drug Use by Drivers
2007 National Roadside Survey of Alcohol and Drug Use by Drivers
2007 National Roadside Survey of Alcohol and Drug Use by Drivers

You also want an ePaper? Increase the reach of your titles
YUMPU automatically turns print PDFs into web optimized ePapers that Google loves.
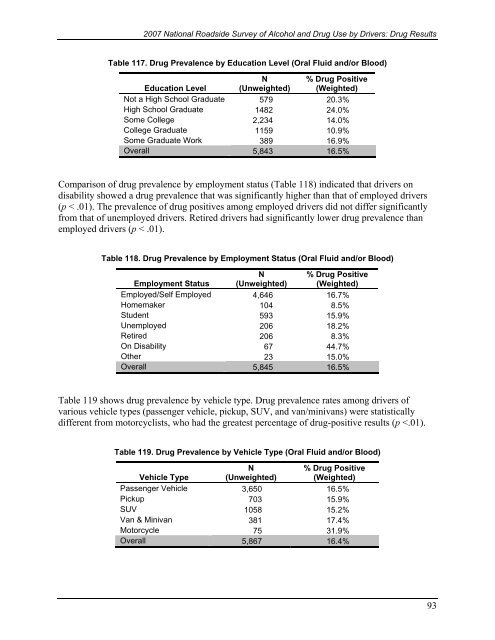
<strong>2007</strong> <strong>National</strong> <strong>Roadside</strong> <strong>Survey</strong> <strong>of</strong> <strong>Alcohol</strong> <strong>and</strong> <strong>Drug</strong> <strong>Use</strong> <strong>by</strong> <strong>Drivers</strong>: <strong>Drug</strong> ResultsTable 117. <strong>Drug</strong> Prevalence <strong>by</strong> Education Level (Oral Fluid <strong>and</strong>/or Blood)Education LevelN(Unweighted)% <strong>Drug</strong> Positive(Weighted)Not a High School Graduate 579 20.3%High School Graduate 1482 24.0%Some College 2,234 14.0%College Graduate 1159 10.9%Some Graduate Work 389 16.9%Overall 5,843 16.5%Comparison <strong>of</strong> drug prevalence <strong>by</strong> employment status (Table 118) indicated that drivers ondisability showed a drug prevalence that was significantly higher than that <strong>of</strong> employed drivers(p < .01). The prevalence <strong>of</strong> drug positives among employed drivers did not differ significantlyfrom that <strong>of</strong> unemployed drivers. Retired drivers had significantly lower drug prevalence thanemployed drivers (p < .01).Table 118. <strong>Drug</strong> Prevalence <strong>by</strong> Employment Status (Oral Fluid <strong>and</strong>/or Blood)Employment StatusN(Unweighted)% <strong>Drug</strong> Positive(Weighted)Employed/Self Employed 4,646 16.7%Homemaker 104 8.5%Student 593 15.9%Unemployed 206 18.2%Retired 206 8.3%On Disability 67 44.7%Other 23 15.0%Overall 5,845 16.5%Table 119 shows drug prevalence <strong>by</strong> vehicle type. <strong>Drug</strong> prevalence rates among drivers <strong>of</strong>various vehicle types (passenger vehicle, pickup, SUV, <strong>and</strong> van/minivans) were statisticallydifferent from motorcyclists, who had the greatest percentage <strong>of</strong> drug-positive results (p

