

2007 National Roadside Survey of Alcohol and Drug Use by Drivers
2007 National Roadside Survey of Alcohol and Drug Use by Drivers
2007 National Roadside Survey of Alcohol and Drug Use by Drivers

Create successful ePaper yourself
Turn your PDF publications into a flip-book with our unique Google optimized e-Paper software.
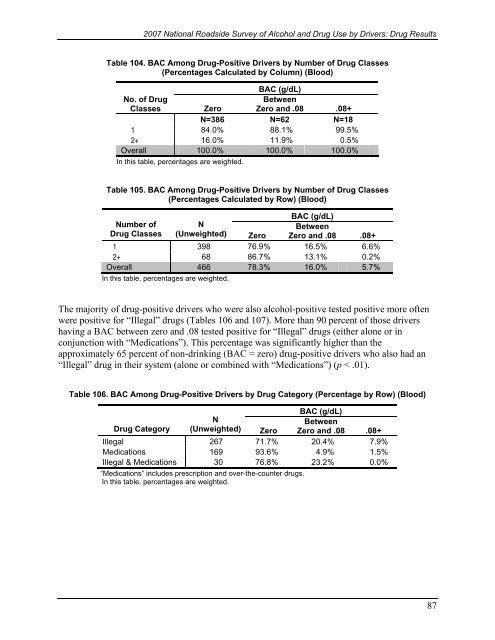
<strong>2007</strong> <strong>National</strong> <strong>Roadside</strong> <strong>Survey</strong> <strong>of</strong> <strong>Alcohol</strong> <strong>and</strong> <strong>Drug</strong> <strong>Use</strong> <strong>by</strong> <strong>Drivers</strong>: <strong>Drug</strong> ResultsTable 104. BAC Among <strong>Drug</strong>-Positive <strong>Drivers</strong> <strong>by</strong> Number <strong>of</strong> <strong>Drug</strong> Classes(Percentages Calculated <strong>by</strong> Column) (Blood)BAC (g/dL)No. <strong>of</strong> <strong>Drug</strong>ClassesZeroBetweenZero <strong>and</strong> .08 .08+N=386 N=62 N=181 84.0% 88.1% 99.5%2+ 16.0% 11.9% 0.5%Overall 100.0% 100.0% 100.0%In this table, percentages are weighted.Table 105. BAC Among <strong>Drug</strong>-Positive <strong>Drivers</strong> <strong>by</strong> Number <strong>of</strong> <strong>Drug</strong> Classes(Percentages Calculated <strong>by</strong> Row) (Blood)BAC (g/dL)Number <strong>of</strong>NBetween<strong>Drug</strong> Classes (Unweighted) Zero Zero <strong>and</strong> .08 .08+1 398 76.9% 16.5% 6.6%2+ 68 86.7% 13.1% 0.2%Overall 466 78.3% 16.0% 5.7%In this table, percentages are weighted.The majority <strong>of</strong> drug-positive drivers who were also alcohol-positive tested positive more <strong>of</strong>tenwere positive for “Illegal” drugs (Tables 106 <strong>and</strong> 107). More than 90 percent <strong>of</strong> those drivershaving a BAC between zero <strong>and</strong> .08 tested positive for “Illegal” drugs (either alone or inconjunction with “Medications”). This percentage was significantly higher than theapproximately 65 percent <strong>of</strong> non-drinking (BAC = zero) drug-positive drivers who also had an“Illegal” drug in their system (alone or combined with “Medications”) (p < .01).Table 106. BAC Among <strong>Drug</strong>-Positive <strong>Drivers</strong> <strong>by</strong> <strong>Drug</strong> Category (Percentage <strong>by</strong> Row) (Blood)BAC (g/dL)<strong>Drug</strong> CategoryNBetween(Unweighted) Zero Zero <strong>and</strong> .08 .08+Illegal 267 71.7% 20.4% 7.9%Medications 169 93.6% 4.9% 1.5%Illegal & Medications 30 76.8% 23.2% 0.0%“Medications” includes prescription <strong>and</strong> over-the-counter drugs.In this table, percentages are weighted.87

