

2007 National Roadside Survey of Alcohol and Drug Use by Drivers
2007 National Roadside Survey of Alcohol and Drug Use by Drivers
2007 National Roadside Survey of Alcohol and Drug Use by Drivers

Create successful ePaper yourself
Turn your PDF publications into a flip-book with our unique Google optimized e-Paper software.
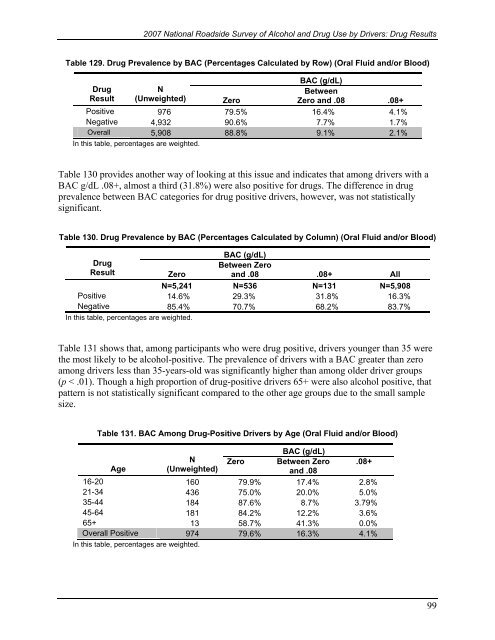
<strong>2007</strong> <strong>National</strong> <strong>Roadside</strong> <strong>Survey</strong> <strong>of</strong> <strong>Alcohol</strong> <strong>and</strong> <strong>Drug</strong> <strong>Use</strong> <strong>by</strong> <strong>Drivers</strong>: <strong>Drug</strong> ResultsTable 129. <strong>Drug</strong> Prevalence <strong>by</strong> BAC (Percentages Calculated <strong>by</strong> Row) (Oral Fluid <strong>and</strong>/or Blood)BAC (g/dL)<strong>Drug</strong>NBetweenResult (Unweighted) ZeroZero <strong>and</strong> .08 .08+Positive 976 79.5% 16.4% 4.1%Negative 4,932 90.6% 7.7% 1.7%Overall 5,908 88.8% 9.1% 2.1%In this table, percentages are weighted.Table 130 provides another way <strong>of</strong> looking at this issue <strong>and</strong> indicates that among drivers with aBAC g/dL .08+, almost a third (31.8%) were also positive for drugs. The difference in drugprevalence between BAC categories for drug positive drivers, however, was not statisticallysignificant.Table 130. <strong>Drug</strong> Prevalence <strong>by</strong> BAC (Percentages Calculated <strong>by</strong> Column) (Oral Fluid <strong>and</strong>/or Blood)<strong>Drug</strong>ResultZeroBAC (g/dL)Between Zero<strong>and</strong> .08 .08+ AllN=5,241 N=536 N=131 N=5,908Positive 14.6% 29.3% 31.8% 16.3%Negative 85.4% 70.7% 68.2% 83.7%In this table, percentages are weighted.Table 131 shows that, among participants who were drug positive, drivers younger than 35 werethe most likely to be alcohol-positive. The prevalence <strong>of</strong> drivers with a BAC greater than zeroamong drivers less than 35-years-old was significantly higher than among older driver groups(p < .01). Though a high proportion <strong>of</strong> drug-positive drivers 65+ were also alcohol positive, thatpattern is not statistically significant compared to the other age groups due to the small samplesize.Table 131. BAC Among <strong>Drug</strong>-Positive <strong>Drivers</strong> <strong>by</strong> Age (Oral Fluid <strong>and</strong>/or Blood)BAC (g/dL)AgeN Zero Between Zero .08+(Unweighted)<strong>and</strong> .0816-20 160 79.9% 17.4% 2.8%21-34 436 75.0% 20.0% 5.0%35-44 184 87.6% 8.7% 3.79%45-64 181 84.2% 12.2% 3.6%65+ 13 58.7% 41.3% 0.0%Overall Positive 974 79.6% 16.3% 4.1%In this table, percentages are weighted.99

