

2007 National Roadside Survey of Alcohol and Drug Use by Drivers
2007 National Roadside Survey of Alcohol and Drug Use by Drivers
2007 National Roadside Survey of Alcohol and Drug Use by Drivers

You also want an ePaper? Increase the reach of your titles
YUMPU automatically turns print PDFs into web optimized ePapers that Google loves.
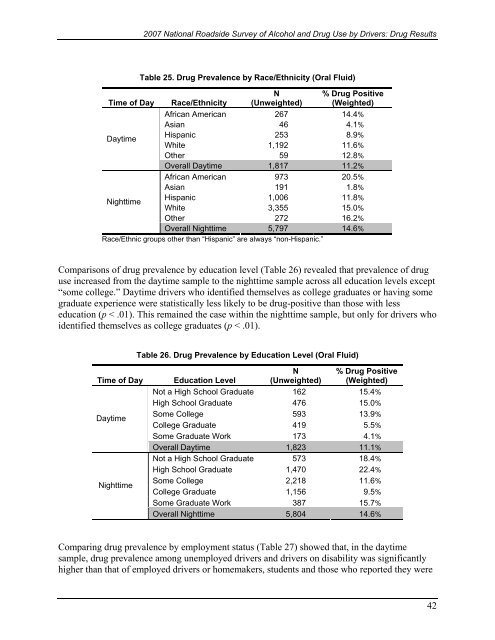
<strong>2007</strong> <strong>National</strong> <strong>Roadside</strong> <strong>Survey</strong> <strong>of</strong> <strong>Alcohol</strong> <strong>and</strong> <strong>Drug</strong> <strong>Use</strong> <strong>by</strong> <strong>Drivers</strong>: <strong>Drug</strong> ResultsTime <strong>of</strong> DayTable 25. <strong>Drug</strong> Prevalence <strong>by</strong> Race/Ethnicity (Oral Fluid)Race/EthnicityN(Unweighted)% <strong>Drug</strong> Positive(Weighted)African American 267 14.4%Asian 46 4.1%Hispanic 253 8.9%DaytimeWhite 1,192 11.6%Other 59 12.8%Overall Daytime 1,817 11.2%African American 973 20.5%Asian 191 1.8%NighttimeHispanic 1,006 11.8%White 3,355 15.0%Other 272 16.2%Overall Nighttime 5,797 14.6%Race/Ethnic groups other than “Hispanic” are always “non-Hispanic.”Comparisons <strong>of</strong> drug prevalence <strong>by</strong> education level (Table 26) revealed that prevalence <strong>of</strong> druguse increased from the daytime sample to the nighttime sample across all education levels except“some college.” Daytime drivers who identified themselves as college graduates or having somegraduate experience were statistically less likely to be drug-positive than those with lesseducation (p < .01). This remained the case within the nighttime sample, but only for drivers whoidentified themselves as college graduates (p < .01).Table 26. <strong>Drug</strong> Prevalence <strong>by</strong> Education Level (Oral Fluid)Time <strong>of</strong> DayDaytimeNighttimeEducation LevelN(Unweighted)% <strong>Drug</strong> Positive(Weighted)Not a High School Graduate 162 15.4%High School Graduate 476 15.0%Some College 593 13.9%College Graduate 419 5.5%Some Graduate Work 173 4.1%Overall Daytime 1,823 11.1%Not a High School Graduate 573 18.4%High School Graduate 1,470 22.4%Some College 2,218 11.6%College Graduate 1,156 9.5%Some Graduate Work 387 15.7%Overall Nighttime 5,804 14.6%Comparing drug prevalence <strong>by</strong> employment status (Table 27) showed that, in the daytimesample, drug prevalence among unemployed drivers <strong>and</strong> drivers on disability was significantlyhigher than that <strong>of</strong> employed drivers or homemakers, students <strong>and</strong> those who reported they were42

