

2007 National Roadside Survey of Alcohol and Drug Use by Drivers
2007 National Roadside Survey of Alcohol and Drug Use by Drivers
2007 National Roadside Survey of Alcohol and Drug Use by Drivers

You also want an ePaper? Increase the reach of your titles
YUMPU automatically turns print PDFs into web optimized ePapers that Google loves.
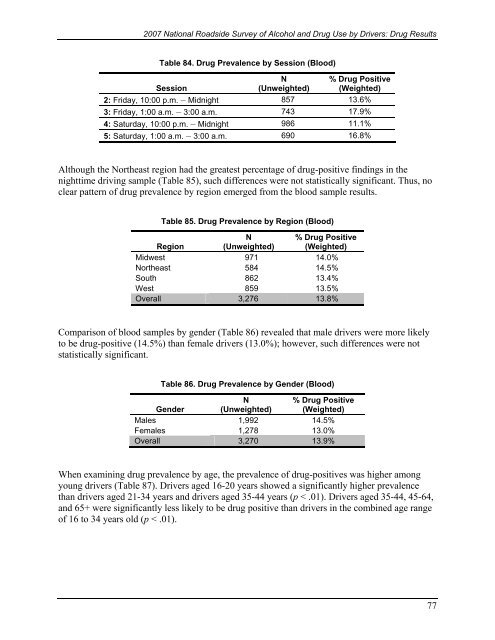
<strong>2007</strong> <strong>National</strong> <strong>Roadside</strong> <strong>Survey</strong> <strong>of</strong> <strong>Alcohol</strong> <strong>and</strong> <strong>Drug</strong> <strong>Use</strong> <strong>by</strong> <strong>Drivers</strong>: <strong>Drug</strong> ResultsTable 84. <strong>Drug</strong> Prevalence <strong>by</strong> Session (Blood)N% <strong>Drug</strong> PositiveSession(Unweighted) (Weighted)2: Friday, 10:00 p.m. – Midnight 857 13.6%3: Friday, 1:00 a.m. – 3:00 a.m. 743 17.9%4: Saturday, 10:00 p.m. – Midnight 986 11.1%5: Saturday, 1:00 a.m. – 3:00 a.m. 690 16.8%Although the Northeast region had the greatest percentage <strong>of</strong> drug-positive findings in thenighttime driving sample (Table 85), such differences were not statistically significant. Thus, noclear pattern <strong>of</strong> drug prevalence <strong>by</strong> region emerged from the blood sample results.Table 85. <strong>Drug</strong> Prevalence <strong>by</strong> Region (Blood)RegionN(Unweighted)% <strong>Drug</strong> Positive(Weighted)Midwest 971 14.0%Northeast 584 14.5%South 862 13.4%West 859 13.5%Overall 3,276 13.8%Comparison <strong>of</strong> blood samples <strong>by</strong> gender (Table 86) revealed that male drivers were more likelyto be drug-positive (14.5%) than female drivers (13.0%); however, such differences were notstatistically significant.Table 86. <strong>Drug</strong> Prevalence <strong>by</strong> Gender (Blood)GenderN(Unweighted)% <strong>Drug</strong> Positive(Weighted)Males 1,992 14.5%Females 1,278 13.0%Overall 3,270 13.9%When examining drug prevalence <strong>by</strong> age, the prevalence <strong>of</strong> drug-positives was higher amongyoung drivers (Table 87). <strong>Drivers</strong> aged 16-20 years showed a significantly higher prevalencethan drivers aged 21-34 years <strong>and</strong> drivers aged 35-44 years (p < .01). <strong>Drivers</strong> aged 35-44, 45-64,<strong>and</strong> 65+ were significantly less likely to be drug positive than drivers in the combined age range<strong>of</strong> 16 to 34 years old (p < .01).77

