

2007 National Roadside Survey of Alcohol and Drug Use by Drivers
2007 National Roadside Survey of Alcohol and Drug Use by Drivers
2007 National Roadside Survey of Alcohol and Drug Use by Drivers

Create successful ePaper yourself
Turn your PDF publications into a flip-book with our unique Google optimized e-Paper software.
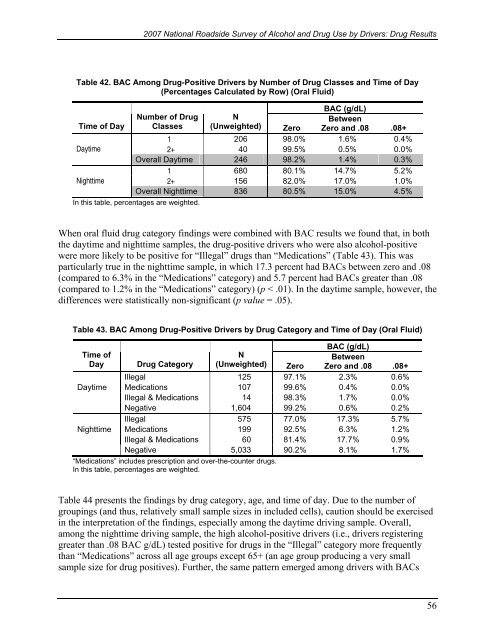
<strong>2007</strong> <strong>National</strong> <strong>Roadside</strong> <strong>Survey</strong> <strong>of</strong> <strong>Alcohol</strong> <strong>and</strong> <strong>Drug</strong> <strong>Use</strong> <strong>by</strong> <strong>Drivers</strong>: <strong>Drug</strong> ResultsTable 42. BAC Among <strong>Drug</strong>-Positive <strong>Drivers</strong> <strong>by</strong> Number <strong>of</strong> <strong>Drug</strong> Classes <strong>and</strong> Time <strong>of</strong> Day(Percentages Calculated <strong>by</strong> Row) (Oral Fluid)Time <strong>of</strong> DayDaytimeNighttimeBAC (g/dL)Number <strong>of</strong> <strong>Drug</strong> NBetweenClasses (Unweighted) Zero Zero <strong>and</strong> .08 .08+1 206 98.0% 1.6% 0.4%2+ 40 99.5% 0.5% 0.0%Overall Daytime 246 98.2% 1.4% 0.3%1 680 80.1% 14.7% 5.2%2+ 156 82.0% 17.0% 1.0%Overall Nighttime 836 80.5% 15.0% 4.5%In this table, percentages are weighted.When oral fluid drug category findings were combined with BAC results we found that, in boththe daytime <strong>and</strong> nighttime samples, the drug-positive drivers who were also alcohol-positivewere more likely to be positive for “Illegal” drugs than “Medications” (Table 43). This wasparticularly true in the nighttime sample, in which 17.3 percent had BACs between zero <strong>and</strong> .08(compared to 6.3% in the “Medications” category) <strong>and</strong> 5.7 percent had BACs greater than .08(compared to 1.2% in the “Medications” category) (p < .01). In the daytime sample, however, thedifferences were statistically non-significant (p value = .05).Table 43. BAC Among <strong>Drug</strong>-Positive <strong>Drivers</strong> <strong>by</strong> <strong>Drug</strong> Category <strong>and</strong> Time <strong>of</strong> Day (Oral Fluid)BAC (g/dL)Time <strong>of</strong>NBetweenDay <strong>Drug</strong> Category (Unweighted) Zero Zero <strong>and</strong> .08 .08+Illegal 125 97.1% 2.3% 0.6%Daytime Medications 107 99.6% 0.4% 0.0%Illegal & Medications 14 98.3% 1.7% 0.0%Negative 1,604 99.2% 0.6% 0.2%Illegal 575 77.0% 17.3% 5.7%Nighttime Medications 199 92.5% 6.3% 1.2%Illegal & Medications 60 81.4% 17.7% 0.9%Negative 5,033 90.2% 8.1% 1.7%“Medications” includes prescription <strong>and</strong> over-the-counter drugs.In this table, percentages are weighted.Table 44 presents the findings <strong>by</strong> drug category, age, <strong>and</strong> time <strong>of</strong> day. Due to the number <strong>of</strong>groupings (<strong>and</strong> thus, relatively small sample sizes in included cells), caution should be exercisedin the interpretation <strong>of</strong> the findings, especially among the daytime driving sample. Overall,among the nighttime driving sample, the high alcohol-positive drivers (i.e., drivers registeringgreater than .08 BAC g/dL) tested positive for drugs in the “Illegal” category more frequentlythan “Medications” across all age groups except 65+ (an age group producing a very smallsample size for drug positives). Further, the same pattern emerged among drivers with BACs56

