

2007 National Roadside Survey of Alcohol and Drug Use by Drivers
2007 National Roadside Survey of Alcohol and Drug Use by Drivers
2007 National Roadside Survey of Alcohol and Drug Use by Drivers

Create successful ePaper yourself
Turn your PDF publications into a flip-book with our unique Google optimized e-Paper software.
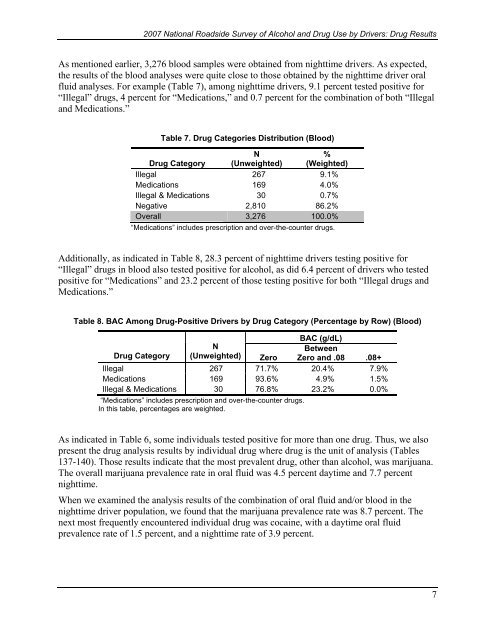
<strong>2007</strong> <strong>National</strong> <strong>Roadside</strong> <strong>Survey</strong> <strong>of</strong> <strong>Alcohol</strong> <strong>and</strong> <strong>Drug</strong> <strong>Use</strong> <strong>by</strong> <strong>Drivers</strong>: <strong>Drug</strong> ResultsAs mentioned earlier, 3,276 blood samples were obtained from nighttime drivers. As expected,the results <strong>of</strong> the blood analyses were quite close to those obtained <strong>by</strong> the nighttime driver oralfluid analyses. For example (Table 7), among nighttime drivers, 9.1 percent tested positive for“Illegal” drugs, 4 percent for “Medications,” <strong>and</strong> 0.7 percent for the combination <strong>of</strong> both “Illegal<strong>and</strong> Medications.”Table 7. <strong>Drug</strong> Categories Distribution (Blood)<strong>Drug</strong> CategoryN(Unweighted)%(Weighted)Illegal 267 9.1%Medications 169 4.0%Illegal & Medications 30 0.7%Negative 2,810 86.2%Overall 3,276 100.0%“Medications” includes prescription <strong>and</strong> over-the-counter drugs.Additionally, as indicated in Table 8, 28.3 percent <strong>of</strong> nighttime drivers testing positive for“Illegal” drugs in blood also tested positive for alcohol, as did 6.4 percent <strong>of</strong> drivers who testedpositive for “Medications” <strong>and</strong> 23.2 percent <strong>of</strong> those testing positive for both “Illegal drugs <strong>and</strong>Medications.”Table 8. BAC Among <strong>Drug</strong>-Positive <strong>Drivers</strong> <strong>by</strong> <strong>Drug</strong> Category (Percentage <strong>by</strong> Row) (Blood)BAC (g/dL)<strong>Drug</strong> CategoryNBetween(Unweighted) Zero Zero <strong>and</strong> .08 .08+Illegal 267 71.7% 20.4% 7.9%Medications 169 93.6% 4.9% 1.5%Illegal & Medications 30 76.8% 23.2% 0.0%“Medications” includes prescription <strong>and</strong> over-the-counter drugs.In this table, percentages are weighted.As indicated in Table 6, some individuals tested positive for more than one drug. Thus, we alsopresent the drug analysis results <strong>by</strong> individual drug where drug is the unit <strong>of</strong> analysis (Tables137-140). Those results indicate that the most prevalent drug, other than alcohol, was marijuana.The overall marijuana prevalence rate in oral fluid was 4.5 percent daytime <strong>and</strong> 7.7 percentnighttime.When we examined the analysis results <strong>of</strong> the combination <strong>of</strong> oral fluid <strong>and</strong>/or blood in thenighttime driver population, we found that the marijuana prevalence rate was 8.7 percent. Thenext most frequently encountered individual drug was cocaine, with a daytime oral fluidprevalence rate <strong>of</strong> 1.5 percent, <strong>and</strong> a nighttime rate <strong>of</strong> 3.9 percent.7

