

2007 National Roadside Survey of Alcohol and Drug Use by Drivers
2007 National Roadside Survey of Alcohol and Drug Use by Drivers
2007 National Roadside Survey of Alcohol and Drug Use by Drivers

Create successful ePaper yourself
Turn your PDF publications into a flip-book with our unique Google optimized e-Paper software.
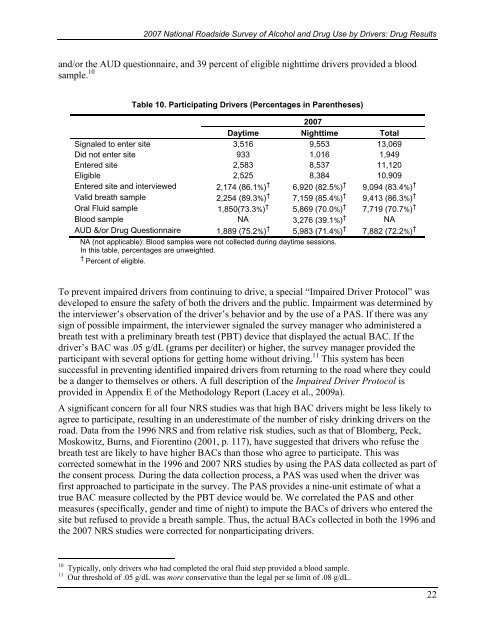
<strong>2007</strong> <strong>National</strong> <strong>Roadside</strong> <strong>Survey</strong> <strong>of</strong> <strong>Alcohol</strong> <strong>and</strong> <strong>Drug</strong> <strong>Use</strong> <strong>by</strong> <strong>Drivers</strong>: <strong>Drug</strong> Results<strong>and</strong>/or the AUD questionnaire, <strong>and</strong> 39 percent <strong>of</strong> eligible nighttime drivers provided a bloodsample. 10Table 10. Participating <strong>Drivers</strong> (Percentages in Parentheses)<strong>2007</strong>Daytime Nighttime TotalSignaled to enter site 3,516 9,553 13,069Did not enter site 933 1,016 1,949Entered site 2,583 8,537 11,120Eligible 2,525 8,384 10,909Entered site <strong>and</strong> interviewed 2,174 (86.1%) † 6,920 (82.5%) † 9,094 (83.4%) †Valid breath sample 2,254 (89.3%) † 7,159 (85.4%) † 9,413 (86.3%) †Oral Fluid sample 1,850(73.3%) † 5,869 (70.0%) † 7,719 (70.7%) †Blood sample NA 3,276 (39.1%) † NAAUD &/or <strong>Drug</strong> Questionnaire 1,889 (75.2%) † 5,983 (71.4%) † 7,882 (72.2%) †NA (not applicable): Blood samples were not collected during daytime sessions.In this table, percentages are unweighted.† Percent <strong>of</strong> eligible.To prevent impaired drivers from continuing to drive, a special “Impaired Driver Protocol” wasdeveloped to ensure the safety <strong>of</strong> both the drivers <strong>and</strong> the public. Impairment was determined <strong>by</strong>the interviewer’s observation <strong>of</strong> the driver’s behavior <strong>and</strong> <strong>by</strong> the use <strong>of</strong> a PAS. If there was anysign <strong>of</strong> possible impairment, the interviewer signaled the survey manager who administered abreath test with a preliminary breath test (PBT) device that displayed the actual BAC. If thedriver’s BAC was .05 g/dL (grams per deciliter) or higher, the survey manager provided theparticipant with several options for getting home without driving. 11 This system has beensuccessful in preventing identified impaired drivers from returning to the road where they couldbe a danger to themselves or others. A full description <strong>of</strong> the Impaired Driver Protocol isprovided in Appendix E <strong>of</strong> the Methodology Report (Lacey et al., 2009a).A significant concern for all four NRS studies was that high BAC drivers might be less likely toagree to participate, resulting in an underestimate <strong>of</strong> the number <strong>of</strong> risky drinking drivers on theroad. Data from the 1996 NRS <strong>and</strong> from relative risk studies, such as that <strong>of</strong> Blomberg, Peck,Moskowitz, Burns, <strong>and</strong> Fiorentino (2001, p. 117), have suggested that drivers who refuse thebreath test are likely to have higher BACs than those who agree to participate. This wascorrected somewhat in the 1996 <strong>and</strong> <strong>2007</strong> NRS studies <strong>by</strong> using the PAS data collected as part <strong>of</strong>the consent process. During the data collection process, a PAS was used when the driver wasfirst approached to participate in the survey. The PAS provides a nine-unit estimate <strong>of</strong> what atrue BAC measure collected <strong>by</strong> the PBT device would be. We correlated the PAS <strong>and</strong> othermeasures (specifically, gender <strong>and</strong> time <strong>of</strong> night) to impute the BACs <strong>of</strong> drivers who entered thesite but refused to provide a breath sample. Thus, the actual BACs collected in both the 1996 <strong>and</strong>the <strong>2007</strong> NRS studies were corrected for nonparticipating drivers.10 Typically, only drivers who had completed the oral fluid step provided a blood sample.11 Our threshold <strong>of</strong> .05 g/dL was more conservative than the legal per se limit <strong>of</strong> .08 g/dL.22

