

2007 National Roadside Survey of Alcohol and Drug Use by Drivers
2007 National Roadside Survey of Alcohol and Drug Use by Drivers
2007 National Roadside Survey of Alcohol and Drug Use by Drivers

Create successful ePaper yourself
Turn your PDF publications into a flip-book with our unique Google optimized e-Paper software.
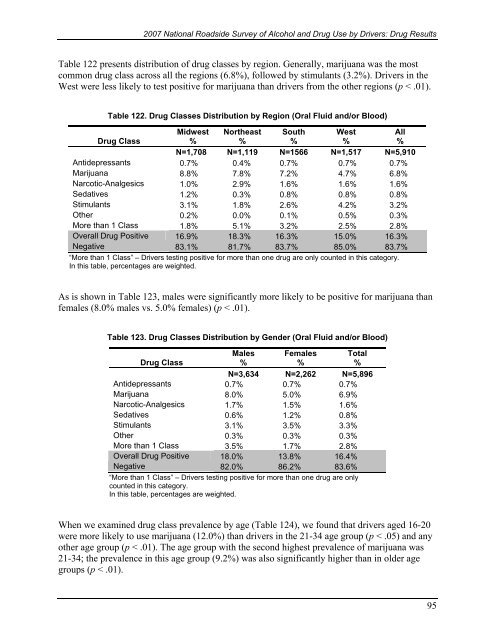
<strong>2007</strong> <strong>National</strong> <strong>Roadside</strong> <strong>Survey</strong> <strong>of</strong> <strong>Alcohol</strong> <strong>and</strong> <strong>Drug</strong> <strong>Use</strong> <strong>by</strong> <strong>Drivers</strong>: <strong>Drug</strong> ResultsTable 122 presents distribution <strong>of</strong> drug classes <strong>by</strong> region. Generally, marijuana was the mostcommon drug class across all the regions (6.8%), followed <strong>by</strong> stimulants (3.2%). <strong>Drivers</strong> in theWest were less likely to test positive for marijuana than drivers from the other regions (p < .01).Table 122. <strong>Drug</strong> Classes Distribution <strong>by</strong> Region (Oral Fluid <strong>and</strong>/or Blood)<strong>Drug</strong> ClassMidwest%Northeast%South%West%All%N=1,708 N=1,119 N=1566 N=1,517 N=5,910Antidepressants 0.7% 0.4% 0.7% 0.7% 0.7%Marijuana 8.8% 7.8% 7.2% 4.7% 6.8%Narcotic-Analgesics 1.0% 2.9% 1.6% 1.6% 1.6%Sedatives 1.2% 0.3% 0.8% 0.8% 0.8%Stimulants 3.1% 1.8% 2.6% 4.2% 3.2%Other 0.2% 0.0% 0.1% 0.5% 0.3%More than 1 Class 1.8% 5.1% 3.2% 2.5% 2.8%Overall <strong>Drug</strong> Positive 16.9% 18.3% 16.3% 15.0% 16.3%Negative 83.1% 81.7% 83.7% 85.0% 83.7%“More than 1 Class” – <strong>Drivers</strong> testing positive for more than one drug are only counted in this category.In this table, percentages are weighted.As is shown in Table 123, males were significantly more likely to be positive for marijuana thanfemales (8.0% males vs. 5.0% females) (p < .01).Table 123. <strong>Drug</strong> Classes Distribution <strong>by</strong> Gender (Oral Fluid <strong>and</strong>/or Blood)<strong>Drug</strong> ClassMales%Females%Total%N=3,634 N=2,262 N=5,896Antidepressants 0.7% 0.7% 0.7%Marijuana 8.0% 5.0% 6.9%Narcotic-Analgesics 1.7% 1.5% 1.6%Sedatives 0.6% 1.2% 0.8%Stimulants 3.1% 3.5% 3.3%Other 0.3% 0.3% 0.3%More than 1 Class 3.5% 1.7% 2.8%Overall <strong>Drug</strong> Positive 18.0% 13.8% 16.4%Negative 82.0% 86.2% 83.6%“More than 1 Class” – <strong>Drivers</strong> testing positive for more than one drug are onlycounted in this category.In this table, percentages are weighted.When we examined drug class prevalence <strong>by</strong> age (Table 124), we found that drivers aged 16-20were more likely to use marijuana (12.0%) than drivers in the 21-34 age group (p < .05) <strong>and</strong> anyother age group (p < .01). The age group with the second highest prevalence <strong>of</strong> marijuana was21-34; the prevalence in this age group (9.2%) was also significantly higher than in older agegroups (p < .01).95

