

2007 National Roadside Survey of Alcohol and Drug Use by Drivers
2007 National Roadside Survey of Alcohol and Drug Use by Drivers
2007 National Roadside Survey of Alcohol and Drug Use by Drivers

You also want an ePaper? Increase the reach of your titles
YUMPU automatically turns print PDFs into web optimized ePapers that Google loves.
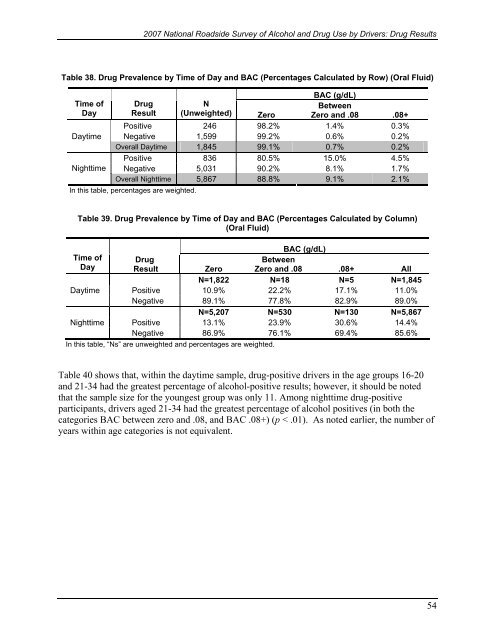
<strong>2007</strong> <strong>National</strong> <strong>Roadside</strong> <strong>Survey</strong> <strong>of</strong> <strong>Alcohol</strong> <strong>and</strong> <strong>Drug</strong> <strong>Use</strong> <strong>by</strong> <strong>Drivers</strong>: <strong>Drug</strong> ResultsTable 38. <strong>Drug</strong> Prevalence <strong>by</strong> Time <strong>of</strong> Day <strong>and</strong> BAC (Percentages Calculated <strong>by</strong> Row) (Oral Fluid)BAC (g/dL)Time <strong>of</strong> <strong>Drug</strong>NBetweenDay Result (Unweighted) Zero Zero <strong>and</strong> .08 .08+Positive 246 98.2% 1.4% 0.3%Daytime Negative 1,599 99.2% 0.6% 0.2%Overall Daytime 1,845 99.1% 0.7% 0.2%Positive 836 80.5% 15.0% 4.5%Nighttime Negative 5,031 90.2% 8.1% 1.7%Overall Nighttime 5,867 88.8% 9.1% 2.1%In this table, percentages are weighted.Table 39. <strong>Drug</strong> Prevalence <strong>by</strong> Time <strong>of</strong> Day <strong>and</strong> BAC (Percentages Calculated <strong>by</strong> Column)(Oral Fluid)BAC (g/dL)Time <strong>of</strong> <strong>Drug</strong>BetweenDay ResultZero Zero <strong>and</strong> .08 .08+ AllN=1,822 N=18 N=5 N=1,845Daytime Positive 10.9% 22.2% 17.1% 11.0%Negative 89.1% 77.8% 82.9% 89.0%N=5,207 N=530 N=130 N=5,867Nighttime Positive 13.1% 23.9% 30.6% 14.4%Negative 86.9% 76.1% 69.4% 85.6%In this table, “Ns” are unweighted <strong>and</strong> percentages are weighted.Table 40 shows that, within the daytime sample, drug-positive drivers in the age groups 16-20<strong>and</strong> 21-34 had the greatest percentage <strong>of</strong> alcohol-positive results; however, it should be notedthat the sample size for the youngest group was only 11. Among nighttime drug-positiveparticipants, drivers aged 21-34 had the greatest percentage <strong>of</strong> alcohol positives (in both thecategories BAC between zero <strong>and</strong> .08, <strong>and</strong> BAC .08+) (p < .01). As noted earlier, the number <strong>of</strong>years within age categories is not equivalent.54

