

2007 National Roadside Survey of Alcohol and Drug Use by Drivers
2007 National Roadside Survey of Alcohol and Drug Use by Drivers
2007 National Roadside Survey of Alcohol and Drug Use by Drivers

Create successful ePaper yourself
Turn your PDF publications into a flip-book with our unique Google optimized e-Paper software.
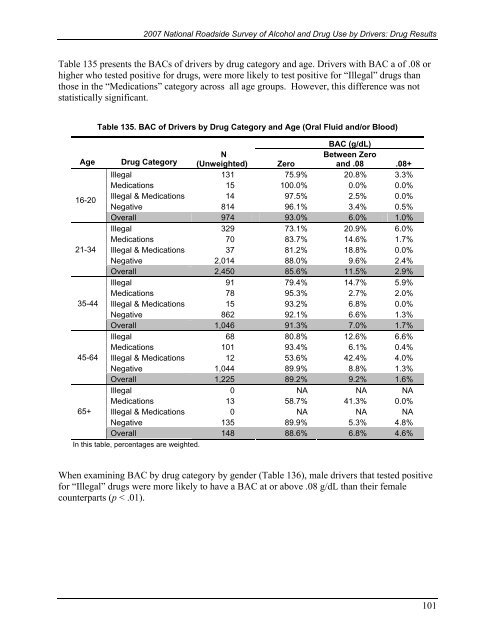
<strong>2007</strong> <strong>National</strong> <strong>Roadside</strong> <strong>Survey</strong> <strong>of</strong> <strong>Alcohol</strong> <strong>and</strong> <strong>Drug</strong> <strong>Use</strong> <strong>by</strong> <strong>Drivers</strong>: <strong>Drug</strong> ResultsTable 135 presents the BACs <strong>of</strong> drivers <strong>by</strong> drug category <strong>and</strong> age. <strong>Drivers</strong> with BAC a <strong>of</strong> .08 orhigher who tested positive for drugs, were more likely to test positive for “Illegal” drugs thanthose in the “Medications” category across all age groups. However, this difference was notstatistically significant.Table 135. BAC <strong>of</strong> <strong>Drivers</strong> <strong>by</strong> <strong>Drug</strong> Category <strong>and</strong> Age (Oral Fluid <strong>and</strong>/or Blood)BAC (g/dL)Age <strong>Drug</strong> CategoryNBetween Zero(Unweighted) Zero<strong>and</strong> .08 .08+Illegal 131 75.9% 20.8% 3.3%Medications 15 100.0% 0.0% 0.0%16-20Illegal & Medications 14 97.5% 2.5% 0.0%Negative 814 96.1% 3.4% 0.5%Overall 974 93.0% 6.0% 1.0%Illegal 329 73.1% 20.9% 6.0%Medications 70 83.7% 14.6% 1.7%21-34 Illegal & Medications 37 81.2% 18.8% 0.0%Negative 2,014 88.0% 9.6% 2.4%Overall 2,450 85.6% 11.5% 2.9%Illegal 91 79.4% 14.7% 5.9%Medications 78 95.3% 2.7% 2.0%35-44 Illegal & Medications 15 93.2% 6.8% 0.0%Negative 862 92.1% 6.6% 1.3%Overall 1,046 91.3% 7.0% 1.7%Illegal 68 80.8% 12.6% 6.6%Medications 101 93.4% 6.1% 0.4%45-64 Illegal & Medications 12 53.6% 42.4% 4.0%Negative 1,044 89.9% 8.8% 1.3%Overall 1,225 89.2% 9.2% 1.6%Illegal 0 NA NA NAMedications 13 58.7% 41.3% 0.0%65+ Illegal & Medications 0 NA NA NANegative 135 89.9% 5.3% 4.8%Overall 148 88.6% 6.8% 4.6%In this table, percentages are weighted.When examining BAC <strong>by</strong> drug category <strong>by</strong> gender (Table 136), male drivers that tested positivefor “Illegal” drugs were more likely to have a BAC at or above .08 g/dL than their femalecounterparts (p < .01).101

