

2007 National Roadside Survey of Alcohol and Drug Use by Drivers
2007 National Roadside Survey of Alcohol and Drug Use by Drivers
2007 National Roadside Survey of Alcohol and Drug Use by Drivers

Create successful ePaper yourself
Turn your PDF publications into a flip-book with our unique Google optimized e-Paper software.
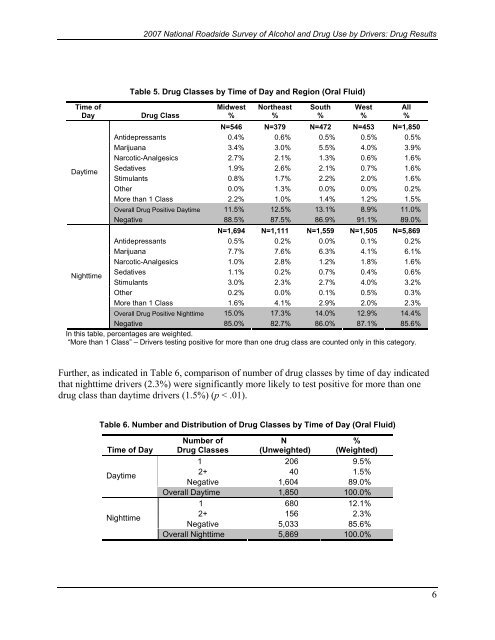
<strong>2007</strong> <strong>National</strong> <strong>Roadside</strong> <strong>Survey</strong> <strong>of</strong> <strong>Alcohol</strong> <strong>and</strong> <strong>Drug</strong> <strong>Use</strong> <strong>by</strong> <strong>Drivers</strong>: <strong>Drug</strong> ResultsTime <strong>of</strong>DayDaytimeTable 5. <strong>Drug</strong> Classes <strong>by</strong> Time <strong>of</strong> Day <strong>and</strong> Region (Oral Fluid)<strong>Drug</strong> ClassMidwest%Northeast%South%West%N=546 N=379 N=472 N=453 N=1,850Antidepressants 0.4% 0.6% 0.5% 0.5% 0.5%Marijuana 3.4% 3.0% 5.5% 4.0% 3.9%Narcotic-Analgesics 2.7% 2.1% 1.3% 0.6% 1.6%Sedatives 1.9% 2.6% 2.1% 0.7% 1.6%Stimulants 0.8% 1.7% 2.2% 2.0% 1.6%Other 0.0% 1.3% 0.0% 0.0% 0.2%More than 1 Class 2.2% 1.0% 1.4% 1.2% 1.5%Overall <strong>Drug</strong> Positive Daytime 11.5% 12.5% 13.1% 8.9% 11.0%Negative 88.5% 87.5% 86.9% 91.1% 89.0%N=1,694 N=1,111 N=1,559 N=1,505 N=5,869Antidepressants 0.5% 0.2% 0.0% 0.1% 0.2%Marijuana 7.7% 7.6% 6.3% 4.1% 6.1%Narcotic-Analgesics 1.0% 2.8% 1.2% 1.8% 1.6%NighttimeSedatives 1.1% 0.2% 0.7% 0.4% 0.6%Stimulants 3.0% 2.3% 2.7% 4.0% 3.2%Other 0.2% 0.0% 0.1% 0.5% 0.3%More than 1 Class 1.6% 4.1% 2.9% 2.0% 2.3%Overall <strong>Drug</strong> Positive Nighttime 15.0% 17.3% 14.0% 12.9% 14.4%Negative 85.0% 82.7% 86.0% 87.1% 85.6%In this table, percentages are weighted.“More than 1 Class” – <strong>Drivers</strong> testing positive for more than one drug class are counted only in this category.All%Further, as indicated in Table 6, comparison <strong>of</strong> number <strong>of</strong> drug classes <strong>by</strong> time <strong>of</strong> day indicatedthat nighttime drivers (2.3%) were significantly more likely to test positive for more than onedrug class than daytime drivers (1.5%) (p < .01).Table 6. Number <strong>and</strong> Distribution <strong>of</strong> <strong>Drug</strong> Classes <strong>by</strong> Time <strong>of</strong> Day (Oral Fluid)Time <strong>of</strong> DayDaytimeNighttimeNumber <strong>of</strong><strong>Drug</strong> ClassesN(Unweighted)%(Weighted)1 206 9.5%2+ 40 1.5%Negative 1,604 89.0%Overall Daytime 1,850 100.0%1 680 12.1%2+ 156 2.3%Negative 5,033 85.6%Overall Nighttime 5,869 100.0%6

