Creative Economy: A Feasible Development Option
Creative Economy: A Feasible Development Option
Creative Economy: A Feasible Development Option
- No tags were found...
You also want an ePaper? Increase the reach of your titles
YUMPU automatically turns print PDFs into web optimized ePapers that Google loves.
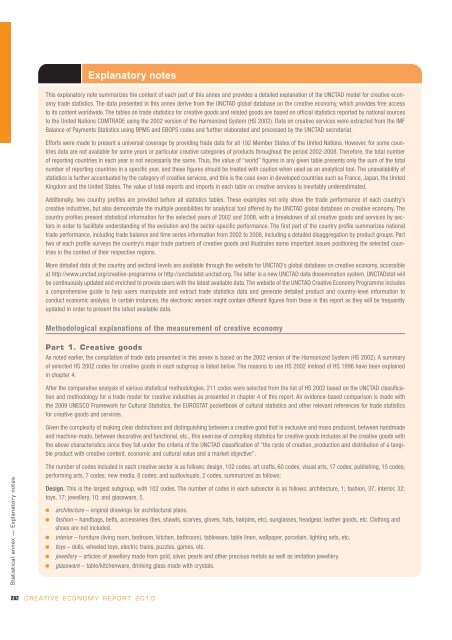
Explanatory notesThis explanatory note summarizes the content of each part of this annex and provides a detailed explanation of the UNCTAD model for creative economytrade statistics. The data presented in this annex derive from the UNCTAD global database on the creative economy, which provides free accessto its content worldwide. The tables on trade statistics for creative goods and related goods are based on official statistics reported by national sourcesto the United Nations COMTRADE using the 2002 version of the Harmonized System (HS 2002). Data on creative services were extracted from the IMFBalance of Payments Statistics using BPM5 and EBOPS codes and further elaborated and processed by the UNCTAD secretariat.Efforts were made to present a universal coverage by providing trade data for all 192 Member States of the United Nations. However, for some countriesdata are not available for some years or particular creative categories of products throughout the period 2002-2008. Therefore, the total numberof reporting countries in each year is not necessarily the same. Thus, the value of “world” figures in any given table presents only the sum of the totalnumber of reporting countries in a specific year, and these figures should be treated with caution when used as an analytical tool. The unavailability ofstatistics is further accentuated by the category of creative services, and this is the case even in developed countries such as France, Japan, the UnitedKingdom and the United States. The value of total exports and imports in each table on creative services is inevitably underestimated.Additionally, two country profiles are provided before all statistics tables. These examples not only show the trade performance of each country’screative industries, but also demonstrate the multiple possibilities for analytical tool offered by the UNCTAD global database on creative economy. Thecountry profiles present statistical information for the selected years of 2002 and 2008, with a breakdown of all creative goods and services by sectorsin order to facilitate understanding of the evolution and the sector-specific performance. The first part of the country profile summarizes nationaltrade performance, including trade balance and time series information from 2002 to 2008, including a detailed disaggregation by product groups. Parttwo of each profile surveys the country’s major trade partners of creative goods and illustrates some important issues positioning the selected countriesin the context of their respective regions.More detailed data at the country and sectoral levels are available through the website for UNCTAD’s global database on creative economy, accessibleat http://www.unctad.org/creative-programme or http://unctadstat.unctad.org. The latter is a new UNCTAD data dissemination system. UNCTADstat willbe continuously updated and enriched to provide users with the latest available data. The website of the UNCTAD <strong>Creative</strong> <strong>Economy</strong> Programme includesa comprehensive guide to help users manipulate and extract trade statistics data and generate detailed product and country-level information toconduct economic analysis. In certain instances, the electronic version might contain different figures from those in this report as they will be frequentlyupdated in order to present the latest available data.Methodological explanations of the measurement of creative economyPart 1. <strong>Creative</strong> goodsAs noted earlier, the compilation of trade data presented in this annex is based on the 2002 version of the Harmonized System (HS 2002). A summaryof selected HS 2002 codes for creative goods in each subgroup is listed below. The reasons to use HS 2002 instead of HS 1996 have been explainedin chapter 4.After the comparative analysis of various statistical methodologies, 211 codes were selected from the list of HS 2002 based on the UNCTAD classificationand methodology for a trade model for creative industries as presented in chapter 4 of this report. An evidence-based comparison is made withthe 2009 UNESCO Framework for Cultural Statistics, the EUROSTAT pocketbook of cultural statistics and other relevant references for trade statisticsfor creative goods and services.Given the complexity of making clear distinctions and distinguishing between a creative good that is exclusive and mass produced, between handmadeand machine-made, between decorative and functional, etc., this exercise of compiling statistics for creative goods includes all the creative goods withthe above characteristics since they fall under the criteria of the UNCTAD classification of “the cycle of creation, production and distribution of a tangibleproduct with creative content, economic and cultural value and a market objective”.Statistical annex — Explanatory notesThe number of codes included in each creative sector is as follows: design, 102 codes; art crafts, 60 codes; visual arts, 17 codes; publishing, 15 codes;performing arts, 7 codes; new media, 8 codes; and audiovisuals, 2 codes, summarized as follows:Design. This is the largest subgroup, with 102 codes. The number of codes in each subsector is as follows: architecture, 1; fashion, 37; interior, 32;toys, 17; jewellery, 10; and glassware, 5.■■■■■■architecture – original drawings for architectural plans.fashion – handbags, belts, accessories (ties, shawls, scarves, gloves, hats, hairpins, etc), sunglasses, headgear, leather goods, etc. Clothing andshoes are not included.interior – furniture (living room, bedroom, kitchen, bathroom), tableware, table linen, wallpaper, porcelain, lighting sets, etc.toys – dolls, wheeled toys, electric trains, puzzles, games, etc.jewellery – articles of jewellery made from gold, silver, pearls and other precious metals as well as imitation jewellery.glassware – table/kitchenware, drinking glass made with crystals.282CREATIVE ECONOMY REPORT 2010


