- Page 1 and 2:
Файл загружен с http:/
- Page 3 and 4:
ContentsForeword...................
- Page 5 and 6:
3.4.2 Large-scale corporate enterpr
- Page 7 and 8:
7. Technology, connectivity and the
- Page 9 and 10:
LIST OF BOXES1.1 A creative entrepr
- Page 11 and 12:
5.9 Creative goods: Exports, by reg
- Page 13 and 14:
5.13 Audiovisuals: Exports, by econ
- Page 15 and 16:
ForewordThe United Nations publishe
- Page 17 and 18:
AcknowledgementsThe Creative Econom
- Page 19 and 20:
Scope of this reportThe Creative Ec
- Page 21 and 22:
Chapter 1 explores evolving concept
- Page 23 and 24:
Ten key messagesThis policy-oriente
- Page 25 and 26:
IX. In the aftermath of the crisis,
- Page 27 and 28:
GCC Gulf Cooperation CouncilGDP Gro
- Page 29 and 30:
The Creative Economy1PART
- Page 31 and 32:
CHAPTER1Conceptand context of thecr
- Page 34 and 35:
1Concept and context of the creativ
- Page 36 and 37:
1Concept and context of the creativ
- Page 38 and 39:
1Concept and context of the creativ
- Page 40 and 41:
1Box 1.1 continuedA creative entrep
- Page 42 and 43:
1Box 1.2 continuedThe creative city
- Page 44 and 45:
1Concept and context of the creativ
- Page 46 and 47:
1Concept and context of the creativ
- Page 48 and 49:
1Concept and context of the creativ
- Page 50 and 51:
1Concept and context of the creativ
- Page 52 and 53:
1Concept and context of the creativ
- Page 54 and 55:
1Concept and context of the creativ
- Page 56 and 57:
1Concept and context of the creativ
- Page 58 and 59:
1Concept and context of the creativ
- Page 60 and 61:
1Concept and context of the creativ
- Page 62 and 63:
2The development dimensioneties. Th
- Page 64 and 65:
Box 2.1South-South sharing of creat
- Page 66 and 67:
2The development dimension2.2.3 Soc
- Page 68 and 69:
2Box 2.2 continuedBrazilian carniva
- Page 70 and 71:
Box 2.3Africa Remix: Africa speakin
- Page 72 and 73:
2The development dimensionrequire c
- Page 74 and 75:
2The development dimensionconcrete
- Page 76 and 77:
2The development dimensionreforms,
- Page 78 and 79:
2The development dimensionThailand:
- Page 80 and 81:
2The development dimensionTurkey: I
- Page 82 and 83:
2The development dimensionMinistry.
- Page 84 and 85:
2The development dimensionvisual ar
- Page 86 and 87:
2The development dimension2.4.5 The
- Page 88 and 89:
Box 2.7 continuedBrand Jamaica as t
- Page 90 and 91:
2The development dimensionpublisher
- Page 92 and 93:
Box 2.8 continuedThe Bolshoi: A sub
- Page 94 and 95:
2The development dimension2.5.1 Cre
- Page 96 and 97:
2The development dimension■solar
- Page 98 and 99:
2The development dimensionBox 2.13E
- Page 100 and 101:
72 CREATIVE ECONOMY REPORT 2010
- Page 102 and 103:
3.2 Organization of the creative ec
- Page 104 and 105:
3Analysing the creative economythat
- Page 106 and 107:
3Analysing the creative economyketi
- Page 108 and 109:
3Analysing the creative economydiff
- Page 110 and 111:
3Analysing the creative economy3.3.
- Page 112 and 113:
3Analysing the creative economychai
- Page 114 and 115:
3Analysing the creative economygrou
- Page 116 and 117:
6766.966.27878.179.7*3940.041.6*363
- Page 118 and 119:
3Analysing the creative economyissu
- Page 120 and 121:
3Analysing the creative economybeca
- Page 122 and 123:
3Analysing the creative economy■
- Page 124 and 125:
4Towards an evidence-based assessme
- Page 126 and 127:
4Towards an evidence-based assessme
- Page 128 and 129:
4Towards an evidence-based assessme
- Page 130 and 131:
4Towards an evidence-based assessme
- Page 132 and 133:
4.7 The case for a trade model for
- Page 134 and 135:
elated to need and comparable. Seco
- Page 136 and 137:
4Towards an evidence-based assessme
- Page 138 and 139:
4.8.2 Summary comparison of statist
- Page 140 and 141:
4Towards an evidence-based assessme
- Page 142 and 143:
Table 4.4 continuedCreative service
- Page 144 and 145:
■■The same rationale applies to
- Page 146 and 147:
4Towards an evidence-based assessme
- Page 148 and 149:
Box 4.1Reality and numbers4Towards
- Page 150 and 151:
4Towards an evidence-based assessme
- Page 152 and 153:
124 CREATIVE ECONOMY REPORT 2010
- Page 154 and 155:
5importing countries. It is not yet
- Page 156 and 157:
5International trade in creative go
- Page 158 and 159:
Chart 5.4a Share of economic groups
- Page 161 and 162:
Chart 5.6AlldevelopingeconomiesAsia
- Page 163 and 164:
profile their trade performance in
- Page 165 and 166:
82.5 per cent in 2002 to 77 per cen
- Page 167 and 168:
Trade (GATT) and Article V of the G
- Page 169 and 170:
Table 5.12aRankExporterArt crafts:
- Page 171 and 172:
socio-economic growth, performing a
- Page 173 and 174:
Tajikistan), underscores the promis
- Page 175 and 176:
except in South Africa. Recently st
- Page 177 and 178:
from $3.5 billion in 2002 to $7 bil
- Page 179 and 180:
India remains the world largest fil
- Page 181 and 182:
RadioDespite recent changes in life
- Page 183 and 184:
first and second, exporting nearly
- Page 185 and 186:
The aim of this report is to sensit
- Page 187 and 188:
ative content. Issues relating to m
- Page 189 and 190:
tions. The rationale for including
- Page 191 and 192:
Table 5.28Chart 5.19(in billions of
- Page 193 and 194:
Table 5.30 Related goods: Imports,
- Page 195 and 196:
The Role of IntellectualProperty an
- Page 197 and 198:
CHAPTER6Therole of intellectual pro
- Page 199 and 200:
Box 6.1Design as a key ingredient f
- Page 201 and 202:
defined in national legislation. Th
- Page 203 and 204:
has developed rapidly over the last
- Page 205 and 206:
and made commercially available by
- Page 207 and 208:
NO DERIVATIVE WORKSAllows others to
- Page 209 and 210:
In 2006, WIPO published National St
- Page 211 and 212:
Box 6.4Jewellery: A magic marriage
- Page 213 and 214:
ing at least until the first sale o
- Page 215 and 216:
tial. The right balance should be f
- Page 217 and 218:
CHAPTER7Technology,connectivityand
- Page 219 and 220:
m-commerce and m-banking. Mobile te
- Page 221 and 222:
Figure 7.4Subscribers per 100 inh.4
- Page 223 and 224:
Table 7.2DimensionDigital enablersD
- Page 225 and 226:
Table 7.4Rank1234567891011121314151
- Page 227 and 228:
IPR rights that may be “re-purpos
- Page 229 and 230:
producers; in short, the business m
- Page 231 and 232:
Box 7.2 continuedFree and open-sour
- Page 233 and 234:
patterns developed by ICTs, rich so
- Page 235 and 236:
Promoting the CreativeEconomy for D
- Page 237 and 238:
CHAPTER8Policystrategies for the cr
- Page 239 and 240:
entirely limited to the major urban
- Page 241 and 242:
8.3 The policy processThe process o
- Page 243 and 244:
8.4.2 Provision of finance andinves
- Page 245 and 246:
they operate and to evaluate the sh
- Page 247 and 248:
Box 8.2Alternative Currencies in Br
- Page 249 and 250:
Box 8.3 continuedThe Egyptian film
- Page 251 and 252:
crisis, the active participation to
- Page 253 and 254:
tries to the benefits of growth in
- Page 255 and 256:
There is significant evidence that
- Page 257 and 258:
■■■the desirability of capaci
- Page 259 and 260:
CHAPTER9Theinternational dimensiono
- Page 261 and 262:
the issues relating to trade in aud
- Page 263 and 264:
Development of the European Commiss
- Page 265 and 266:
and bound tariff rates have decline
- Page 267 and 268:
and continue negotiations on the Ag
- Page 269 and 270:
9.3.4 TRIPS AgreementWith respect t
- Page 271 and 272:
9.4 UNESCO cultural-diversity persp
- Page 273 and 274:
9.5 WIPO Development AgendaAt the W
- Page 275 and 276:
Cooperation has continued to work w
- Page 277 and 278:
come obstacles faced by poor commun
- Page 279 and 280:
9.8 UNEP: Promoting biodiversity be
- Page 281 and 282:
CHAPTER10 Lessons learned and polic
- Page 283 and 284:
VI. The creative economy cuts acros
- Page 285 and 286:
the creative industries in the Unit
- Page 287 and 288:
policymakers, researchers and pract
- Page 289 and 290:
Another mechanism to promote South-
- Page 291 and 292:
10.3.2 Role of creative entrepreneu
- Page 293 and 294:
ReferencesBooks and articlesAcheson
- Page 295 and 296:
of Definitions of the Cultural and
- Page 297 and 298:
ativity for its management”, in C
- Page 299 and 300:
Taylor, Calvin (2006). “Beyond Ad
- Page 301 and 302:
Department of Communications, Infor
- Page 303 and 304:
PricewaterhouseCoopers (2008). “G
- Page 305 and 306:
______(2004). São Paulo Consensus:
- Page 307 and 308:
The 2009 UNESCO Framework for Cultu
- Page 309 and 310:
Statistical Annex
- Page 311 and 312:
Explanatory notes (continued)Art cr
- Page 313 and 314:
Explanatory notes (continued)Obviou
- Page 315 and 316:
Explanatory notes (continued)EBOPSE
- Page 317 and 318: Country Profile: Argentina (continu
- Page 319 and 320: Country Profile: Argentina (continu
- Page 321 and 322: Country Profile: Turkey (continued)
- Page 323 and 324: Country Profile: Turkey (continued)
- Page 325 and 326: Distribution of developing economie
- Page 327 and 328: Distribution of developed economies
- Page 329 and 330: Distribution of economies by trade
- Page 331 and 332: TABLE1.1IMPORTS (c.i.f., in million
- Page 333 and 334: TABLE1.1IMPORTS (c.i.f., in million
- Page 335 and 336: TABLE1.1IMPORTS (c.i.f., in million
- Page 337 and 338: TABLE1.2.ADeveloping economiesAsiaE
- Page 339 and 340: TABLE1.2.ADeveloping economiesEaste
- Page 341 and 342: TABLE1.2.BDeveloping economiesAsiaE
- Page 343 and 344: TABLE1.2.BDeveloping economiesEaste
- Page 345 and 346: CREATIVE GOODS: EXPORTS AND IMPORTS
- Page 347 and 348: EXPORTS OF ALL CREATIVE SERVICES (1
- Page 349 and 350: IMPORTS OF ALL CREATIVE SERVICES (1
- Page 351 and 352: EXPORTS OF ADVERTISING AND RELATED
- Page 353 and 354: IMPORTS OF ADVERTISING AND RELATED
- Page 355 and 356: EXPORTS OF ARCHITECTURAL AND RELATE
- Page 357 and 358: IMPORTS OF ARCHITECTURAL AND RELATE
- Page 359 and 360: EXPORTS OF RESEARCH AND DEVELOPMENT
- Page 361 and 362: IMPORTS OF RESEARCH AND DEVELOPMENT
- Page 363 and 364: EXPORTS OF PERSONAL, CULTURAL AND R
- Page 365 and 366: IMPORTS OF PERSONAL, CULTURAL AND R
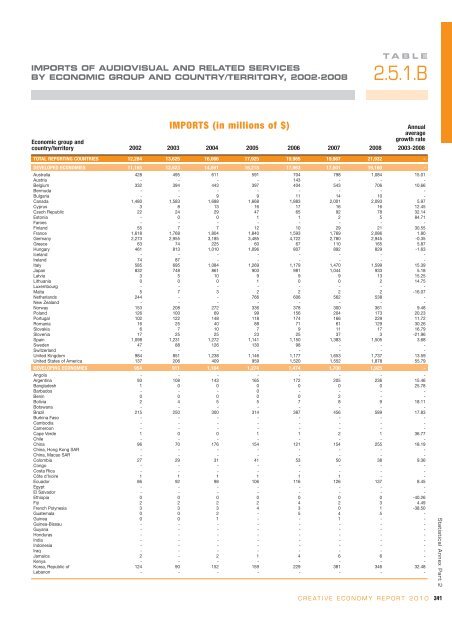
- Page 367: EXPORTS OF AUDIOVISUAL AND RELATED
- Page 371 and 372: EXPORTS OF OTHER PERSONAL, CULTURAL
- Page 373 and 374: IMPORTS OF OTHER PERSONAL, CULTURAL
- Page 375 and 376: Statistical Annex Part 2CREATIVE EC
- Page 377 and 378: TABLE3.1IMPORTS (c.i.f., in million
- Page 379 and 380: TABLE3.1IMPORTS (c.i.f., in million
- Page 381 and 382: TABLE3.1IMPORTS (c.i.f., in million
- Page 383 and 384: TABLE3.2.ADeveloping economies (2)E
- Page 385 and 386: TABLE3.2.BDeveloping economies (2)E
- Page 387 and 388: TABLE3.3.AEXPORTS (in millions of $
- Page 389 and 390: TABLE3.3.AEXPORTS (in millions of $
- Page 391 and 392: TABLE3.3.AEXPORTS (in millions of $
- Page 393 and 394: TABLE3.3.AEXPORTS (in millions of $
- Page 395 and 396: TABLE3.3.BIMPORTS (in millions of $
- Page 397 and 398: TABLE3.3.BIMPORTS (in millions of $
- Page 399 and 400: TABLE3.3.BIMPORTS (in millions of $
- Page 401 and 402: TABLE3.3.BIMPORTS (in millions of $
- Page 403 and 404: TABLE3.4.AEXPORTS (in millions of $
- Page 405 and 406: TABLE3.4.AEXPORTS (in millions of $
- Page 407 and 408: TABLE3.4.AEXPORTS (in millions of $
- Page 409 and 410: TABLE3.4.AEXPORTS (in millions of $
- Page 411 and 412: TABLE3.4.BIMPORTS (in millions of $
- Page 413 and 414: TABLE3.4.BIMPORTS (in millions of $
- Page 415 and 416: TABLE3.4.BIMPORTS (in millions of $
- Page 417 and 418: TABLE3.4.BIMPORTS (in millions of $


