Biofuels in Perspective
Biofuels in Perspective
Biofuels in Perspective

Create successful ePaper yourself
Turn your PDF publications into a flip-book with our unique Google optimized e-Paper software.
140 <strong>Biofuels</strong><br />
Ratio of <strong>in</strong>itial reaction rate (-)<br />
100<br />
80<br />
60<br />
40<br />
20<br />
0<br />
0.0 0.5 1.0<br />
Fatty acid ratio <strong>in</strong>dicated by R f (-)<br />
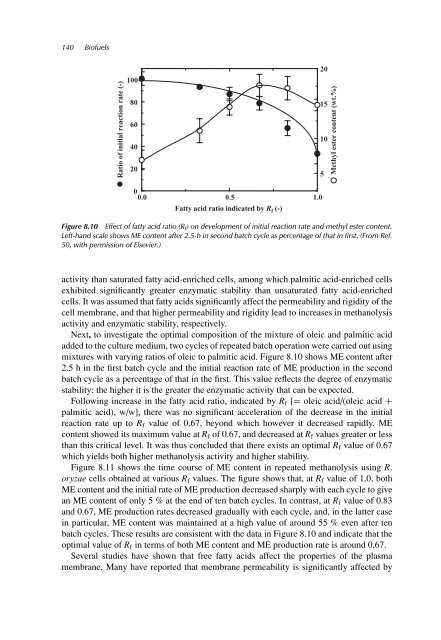
Figure 8.10 Effect of fatty acid ratio (R f) on development of <strong>in</strong>itial reaction rate and methyl ester content.<br />
Left-hand scale shows ME content after 2.5-h <strong>in</strong> second batch cycle as percentage of that <strong>in</strong> first. (From Ref.<br />
50, with permission of Elsevier.)<br />
activity than saturated fatty acid-enriched cells, among which palmitic acid-enriched cells<br />
exhibited significantly greater enzymatic stability than unsaturated fatty acid-enriched<br />
cells. It was assumed that fatty acids significantly affect the permeability and rigidity of the<br />
cell membrane, and that higher permeability and rigidity lead to <strong>in</strong>creases <strong>in</strong> methanolysis<br />
activity and enzymatic stability, respectively.<br />
Next, to <strong>in</strong>vestigate the optimal composition of the mixture of oleic and palmitic acid<br />
added to the culture medium, two cycles of repeated batch operation were carried out us<strong>in</strong>g<br />
mixtures with vary<strong>in</strong>g ratios of oleic to palmitic acid. Figure 8.10 shows ME content after<br />
2.5 h <strong>in</strong> the first batch cycle and the <strong>in</strong>itial reaction rate of ME production <strong>in</strong> the second<br />
batch cycle as a percentage of that <strong>in</strong> the first. This value reflects the degree of enzymatic<br />
stability: the higher it is the greater the enzymatic activity that can be expected.<br />
Follow<strong>in</strong>g <strong>in</strong>crease <strong>in</strong> the fatty acid ratio, <strong>in</strong>dicated by Rf [= oleic acid/(oleic acid +<br />
palmitic acid), w/w], there was no significant acceleration of the decrease <strong>in</strong> the <strong>in</strong>itial<br />
reaction rate up to Rf value of 0.67, beyond which however it decreased rapidly. ME<br />
content showed its maximum value at Rf of 0.67, and decreased at Rf values greater or less<br />
than this critical level. It was thus concluded that there exists an optimal Rf value of 0.67<br />
which yields both higher methanolysis activity and higher stability.<br />
Figure 8.11 shows the time course of ME content <strong>in</strong> repeated methanolysis us<strong>in</strong>g R.<br />
oryzae cells obta<strong>in</strong>ed at various Rf values. The figure shows that, at Rf value of 1.0, both<br />
ME content and the <strong>in</strong>itial rate of ME production decreased sharply with each cycle to give<br />
an ME content of only 5 % at the end of ten batch cycles. In contrast, at Rf value of 0.83<br />
and 0.67, ME production rates decreased gradually with each cycle, and, <strong>in</strong> the latter case<br />
<strong>in</strong> particular, ME content was ma<strong>in</strong>ta<strong>in</strong>ed at a high value of around 55 % even after ten<br />
batch cycles. These results are consistent with the data <strong>in</strong> Figure 8.10 and <strong>in</strong>dicate that the<br />
optimal value of Rf <strong>in</strong> terms of both ME content and ME production rate is around 0.67.<br />
Several studies have shown that free fatty acids affect the properties of the plasma<br />
membrane. Many have reported that membrane permeability is significantly affected by<br />
20<br />
15<br />
10<br />
5<br />
Methyl ester content (wt.%)