

watervulnerability
watervulnerability
watervulnerability

You also want an ePaper? Increase the reach of your titles
YUMPU automatically turns print PDFs into web optimized ePapers that Google loves.
White River National Forest Watershed Vulnerability Assessment, Rocky Mountain Region (R2)<br />
glaciation (0.75), south aspect (0.50), hydroclimatic regime (1.0), weighted precipitation (1.0), extent of<br />
surface water features (1.0), extent of pine beetle mortality (0.5), water uses (1.0), development/roads<br />
(0.5), and the extent of beetle salvage (0.5).<br />
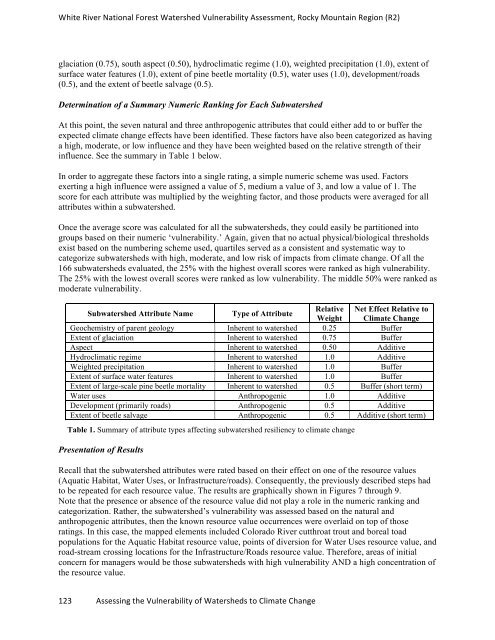
Determination of a Summary Numeric Ranking for Each Subwatershed<br />
At this point, the seven natural and three anthropogenic attributes that could either add to or buffer the<br />
expected climate change effects have been identified. These factors have also been categorized as having<br />
a high, moderate, or low influence and they have been weighted based on the relative strength of their<br />
influence. See the summary in Table 1 below.<br />
In order to aggregate these factors into a single rating, a simple numeric scheme was used. Factors<br />
exerting a high influence were assigned a value of 5, medium a value of 3, and low a value of 1. The<br />
score for each attribute was multiplied by the weighting factor, and those products were averaged for all<br />
attributes within a subwatershed.<br />
Once the average score was calculated for all the subwatersheds, they could easily be partitioned into<br />
groups based on their numeric ‘vulnerability.’ Again, given that no actual physical/biological thresholds<br />
exist based on the numbering scheme used, quartiles served as a consistent and systematic way to<br />
categorize subwatersheds with high, moderate, and low risk of impacts from climate change. Of all the<br />
166 subwatersheds evaluated, the 25% with the highest overall scores were ranked as high vulnerability.<br />
The 25% with the lowest overall scores were ranked as low vulnerability. The middle 50% were ranked as<br />
moderate vulnerability.<br />
Subwatershed Attribute Name Type of Attribute<br />
Relative<br />
Weight<br />
Net Effect Relative to<br />
Climate Change<br />
Geochemistry of parent geology Inherent to watershed 0.25 Buffer<br />
Extent of glaciation Inherent to watershed 0.75 Buffer<br />
Aspect Inherent to watershed 0.50 Additive<br />
Hydroclimatic regime Inherent to watershed 1.0 Additive<br />
Weighted precipitation Inherent to watershed 1.0 Buffer<br />
Extent of surface water features Inherent to watershed 1.0 Buffer<br />
Extent of large-scale pine beetle mortality Inherent to watershed 0.5 Buffer (short term)<br />
Water uses Anthropogenic 1.0 Additive<br />
Development (primarily roads) Anthropogenic 0.5 Additive<br />
Extent of beetle salvage Anthropogenic 0.5 Additive (short term)<br />
Table 1. Summary of attribute types affecting subwatershed resiliency to climate change<br />
Presentation of Results<br />
Recall that the subwatershed attributes were rated based on their effect on one of the resource values<br />
(Aquatic Habitat, Water Uses, or Infrastructure/roads). Consequently, the previously described steps had<br />
to be repeated for each resource value. The results are graphically shown in Figures 7 through 9.<br />
Note that the presence or absence of the resource value did not play a role in the numeric ranking and<br />
categorization. Rather, the subwatershed’s vulnerability was assessed based on the natural and<br />
anthropogenic attributes, then the known resource value occurrences were overlaid on top of those<br />
ratings. In this case, the mapped elements included Colorado River cutthroat trout and boreal toad<br />
populations for the Aquatic Habitat resource value, points of diversion for Water Uses resource value, and<br />
road-stream crossing locations for the Infrastructure/Roads resource value. Therefore, areas of initial<br />
concern for managers would be those subwatersheds with high vulnerability AND a high concentration of<br />
the resource value.<br />
123 Assessing the Vulnerability of Watersheds to Climate Change