

watervulnerability
watervulnerability
watervulnerability

Create successful ePaper yourself
Turn your PDF publications into a flip-book with our unique Google optimized e-Paper software.
Grand Mesa, Uncompahgre and Gunnison National Forest Watershed Vulnerability Assessment, Rocky<br />
Mountain Region (R2)<br />
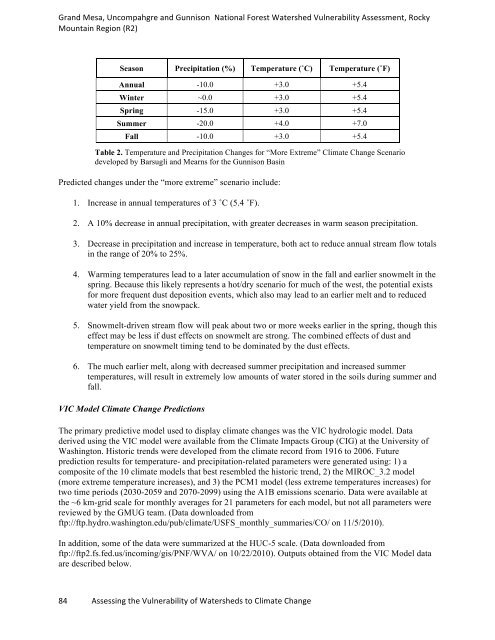
Season Precipitation (%) Temperature (˚C) Temperature (˚F)<br />
Annual -10.0 +3.0 +5.4<br />
Winter ~0.0 +3.0 +5.4<br />
Spring -15.0 +3.0 +5.4<br />
Summer -20.0 +4.0 +7.0<br />
Fall -10.0 +3.0 +5.4<br />
Table 2. Temperature and Precipitation Changes for “More Extreme” Climate Change Scenario<br />
developed by Barsugli and Mearns for the Gunnison Basin<br />
Predicted changes under the “more extreme” scenario include:<br />
1. Increase in annual temperatures of 3 ˚C (5.4 ˚F).<br />
2. A 10% decrease in annual precipitation, with greater decreases in warm season precipitation.<br />
3. Decrease in precipitation and increase in temperature, both act to reduce annual stream flow totals<br />
in the range of 20% to 25%.<br />
4. Warming temperatures lead to a later accumulation of snow in the fall and earlier snowmelt in the<br />
spring. Because this likely represents a hot/dry scenario for much of the west, the potential exists<br />
for more frequent dust deposition events, which also may lead to an earlier melt and to reduced<br />
water yield from the snowpack.<br />
5. Snowmelt-driven stream flow will peak about two or more weeks earlier in the spring, though this<br />
effect may be less if dust effects on snowmelt are strong. The combined effects of dust and<br />
temperature on snowmelt timing tend to be dominated by the dust effects.<br />
6. The much earlier melt, along with decreased summer precipitation and increased summer<br />
temperatures, will result in extremely low amounts of water stored in the soils during summer and<br />
fall.<br />
VIC Model Climate Change Predictions<br />
The primary predictive model used to display climate changes was the VIC hydrologic model. Data<br />
derived using the VIC model were available from the Climate Impacts Group (CIG) at the University of<br />
Washington. Historic trends were developed from the climate record from 1916 to 2006. Future<br />
prediction results for temperature- and precipitation-related parameters were generated using: 1) a<br />
composite of the 10 climate models that best resembled the historic trend, 2) the MIROC_3.2 model<br />
(more extreme temperature increases), and 3) the PCM1 model (less extreme temperatures increases) for<br />
two time periods (2030-2059 and 2070-2099) using the A1B emissions scenario. Data were available at<br />
the ~6 km-grid scale for monthly averages for 21 parameters for each model, but not all parameters were<br />
reviewed by the GMUG team. (Data downloaded from<br />
ftp://ftp.hydro.washington.edu/pub/climate/USFS_monthly_summaries/CO/ on 11/5/2010).<br />
In addition, some of the data were summarized at the HUC-5 scale. (Data downloaded from<br />
ftp://ftp2.fs.fed.us/incoming/gis/PNF/WVA/ on 10/22/2010). Outputs obtained from the VIC Model data<br />
are described below.<br />
84 Assessing the Vulnerability of Watersheds to Climate Change