

watervulnerability
watervulnerability
watervulnerability

You also want an ePaper? Increase the reach of your titles
YUMPU automatically turns print PDFs into web optimized ePapers that Google loves.
Ouachita National Forest Watershed Vulnerability Assessment, Southern Region (R8)<br />
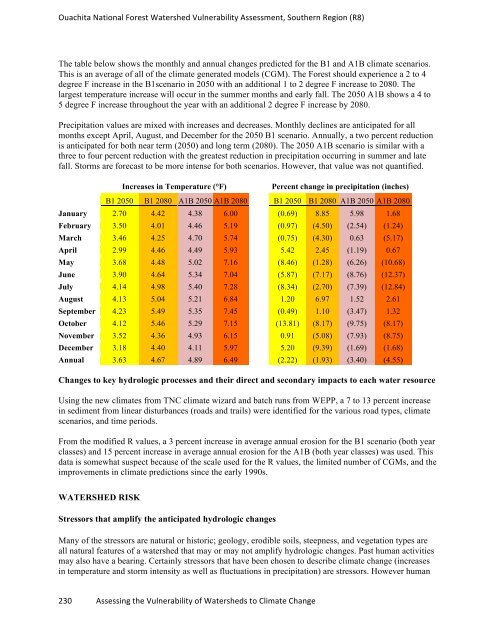
The table below shows the monthly and annual changes predicted for the B1 and A1B climate scenarios.<br />
This is an average of all of the climate generated models (CGM). The Forest should experience a 2 to 4<br />
degree F increase in the B1scenario in 2050 with an additional 1 to 2 degree F increase to 2080. The<br />
largest temperature increase will occur in the summer months and early fall. The 2050 A1B shows a 4 to<br />
5 degree F increase throughout the year with an additional 2 degree F increase by 2080.<br />
Precipitation values are mixed with increases and decreases. Monthly declines are anticipated for all<br />
months except April, August, and December for the 2050 B1 scenario. Annually, a two percent reduction<br />
is anticipated for both near term (2050) and long term (2080). The 2050 A1B scenario is similar with a<br />
three to four percent reduction with the greatest reduction in precipitation occurring in summer and late<br />
fall. Storms are forecast to be more intense for both scenarios. However, that value was not quantified.<br />
Increases in Temperature (°F) Percent change in precipitation (inches)<br />
B1 2050 B1 2080 A1B 2050 A1B 2080<br />
January 2.70 4.42 4.38 6.00<br />
February 3.50 4.01 4.46 5.19<br />
March 3.46 4.25 4.70 5.74<br />
April 2.99 4.46 4.49 5.93<br />
May 3.68 4.48 5.02 7.16<br />
June 3.90 4.64 5.34 7.04<br />
July 4.14 4.98 5.40 7.28<br />
August 4.13 5.04 5.21 6.84<br />
September 4.23 5.49 5.35 7.45<br />
October 4.12 5.46 5.29 7.15<br />
November 3.52 4.36 4.93 6.15<br />
December 3.18 4.40 4.11 5.97<br />
Annual 3.63 4.67 4.89 6.49<br />
230 Assessing the Vulnerability of Watersheds to Climate Change<br />
B1 2050 B1 2080 A1B 2050 A1B 2080<br />
(0.69) 8.85 5.98 1.68<br />
(0.97) (4.50) (2.54) (1.24)<br />
(0.75) (4.30) 0.63 (5.17)<br />
5.42 2.45 (1.19) 0.67<br />
(8.46) (1.28) (6.26) (10.68)<br />
(5.87) (7.17) (8.76) (12.37)<br />
(8.34) (2.70) (7.39) (12.84)<br />
1.20 6.97 1.52 2.61<br />
(0.49) 1.10 (3.47) 1.32<br />
(13.81) (8.17) (9.75) (8.17)<br />
0.91 (5.08) (7.93) (8.75)<br />
5.20 (9.39) (1.69) (1.68)<br />
(2.22) (1.93) (3.40) (4.55)<br />
Changes to key hydrologic processes and their direct and secondary impacts to each water resource<br />
Using the new climates from TNC climate wizard and batch runs from WEPP, a 7 to 13 percent increase<br />
in sediment from linear disturbances (roads and trails) were identified for the various road types, climate<br />
scenarios, and time periods.<br />
From the modified R values, a 3 percent increase in average annual erosion for the B1 scenario (both year<br />
classes) and 15 percent increase in average annual erosion for the A1B (both year classes) was used. This<br />
data is somewhat suspect because of the scale used for the R values, the limited number of CGMs, and the<br />
improvements in climate predictions since the early 1990s.<br />
WATERSHED RISK<br />
Stressors that amplify the anticipated hydrologic changes<br />
Many of the stressors are natural or historic; geology, erodible soils, steepness, and vegetation types are<br />
all natural features of a watershed that may or may not amplify hydrologic changes. Past human activities<br />
may also have a bearing. Certainly stressors that have been chosen to describe climate change (increases<br />
in temperature and storm intensity as well as fluctuations in precipitation) are stressors. However human