

watervulnerability
watervulnerability
watervulnerability

Create successful ePaper yourself
Turn your PDF publications into a flip-book with our unique Google optimized e-Paper software.
determine changes in groundwater levels and flow rates<br />
to lakes, streams, and wetlands.<br />
The analysis on the GMUG NFs differed from other<br />
assessments, in that results were displayed at a large scale.<br />
Six large geographic areas, stratified by climatic regime<br />
and elevation, were used for graphical analysis. Projected<br />
changes to maximum and minimum air temperatures<br />
and an index of aridity were factors used to rate exposure<br />
in each of these geographical areas. This analysis<br />
technique was at least partially driven by the resolution<br />
of the downscaled exposure data, which is typically on<br />
a grid of 6 km2 (Figure 7). This fairly gross resolution<br />
results in as few as two or three data points for a HUC-6,<br />
making discrimination at this scale inappropriate. As a<br />
result, pilots typically used HUC-6 for distinguishing<br />
differences in resource densities and sensitivity, overlaid<br />
with a larger-scale rating of exposure.<br />
Climate models typically provide predictions of<br />
temperature and precipitation. These data are then<br />
combined with characterizations of watershed<br />
characteristics and vegetation in modeling of<br />
other hydrologic variables. CIG has also developed<br />
predictions of hydrologic change based on the Variable<br />
Infiltration Capacity (VIC) model (Gao et al. in review).<br />
The CIG was extremely helpful in releasing data for<br />
use during the pilot study, and in explaining its utility<br />
and limitations. VIC is a distributed, largely physicallybased<br />
macro-scale model that balances water and energy<br />
fluxes at the land surface and takes into account soil<br />
moisture, infiltration, runoff, and baseflow processes<br />
within vegetation classes. It has been widely used in<br />
13 | ASSESSING THE VULNERABILITY OF WATERSHEDS TO CLIMATE CHANGE<br />
Assessment Principle Five: Don't Get Lost in<br />
Exposure Data<br />
Pilot Forests used exposure data of different<br />
specificity and detail (for example, in one<br />
case, only air temperature change; in another,<br />
predicted stream temperatures). The level of<br />
detail influenced the analysis, but the take-home<br />
message is that all levels of exposure projections<br />
produced useable vulnerability assessments.<br />
Detailed projections at management-relevant<br />
scales are not necessary to gauge relative<br />
vulnerability of watersheds. It is more productive<br />
to move forward with the analysis than to get lost<br />
in the details of refining exposure data.<br />
the western U.S. to study past and potential future<br />
changes to water flow regimes (e.g., Hamlet et al. 2009),<br />
snowpacks (Hamlet et al. 2005), and droughts (Luo and<br />
Wood 2007). Several pilots (Helena, GMUG, Coconino,<br />
and Sawtooth NFs) made use of the VIC model outputs<br />
to evaluate exposure. VIC attributes evaluated by pilots<br />
included runoff, baseflow, and snow water equivalent.<br />
Several pilots employed projections of changes to flow<br />
characteristics. These were selected because of their<br />
important influence on habitat for species of concern.<br />
Flow metrics were also useful in describing relative<br />
exposure of water uses. In contrast, predictions of peak-<br />
and low-flow responses to climate change are limited<br />
and consist primarily of generalized predictions of<br />
higher peaks and more severe droughts with warming<br />
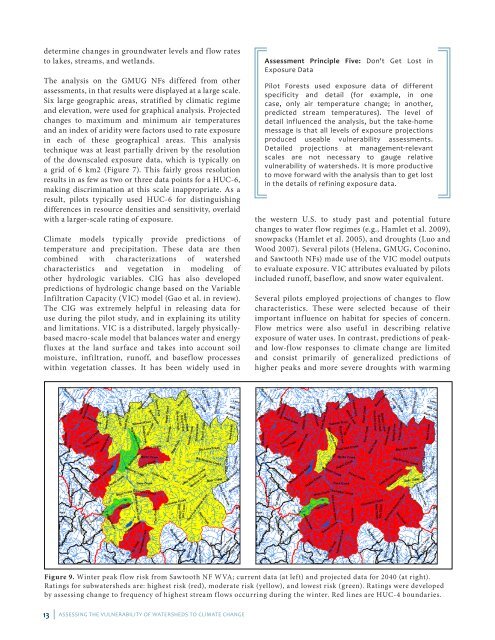
Figure 9. Winter peak flow risk from Sawtooth NF WVA; current data (at left) and projected data for 2040 (at right).<br />
Ratings for subwatersheds are: highest risk (red), moderate risk (yellow), and lowest risk (green). Ratings were developed<br />
by assessing change to frequency of highest stream flows occurring during the winter. Red lines are HUC-4 boundaries.