

watervulnerability
watervulnerability
watervulnerability

Create successful ePaper yourself
Turn your PDF publications into a flip-book with our unique Google optimized e-Paper software.
in exposure. The result of combining these elements is a<br />
classification, typically by subwatershed (HUC-6), that<br />
displays relative vulnerability of the identified values.<br />
All pilot Forests provided a narrative and mapped their<br />
results. Some pilots combined resource values in the<br />
analysis (see Figure 18), and others displayed resource<br />
values separately (Figures 17 and 19). The GMUG NF’s<br />
summary rating of vulnerability was presented in tabular<br />
format (Table 7). The GMUG assessed exposure and<br />
rated vulnerability at the watershed scale. The GMUG’s<br />
adjusted vulnerability ranking combines the ratings of<br />
values, sensitivity, and exposure.<br />
Based on its strong partnership with the Rocky Mountain<br />
Research Station and its access to considerable habitat<br />
condition data (including stream temperature data), the<br />
Sawtooth NF conducted the most detailed evaluation.<br />
The Sawtooth NF analysis included assessing the<br />
effects of potential changes to stream temperature<br />
and flow on bull trout. Potential temperature effects<br />
were analyzed by summarizing the available stream<br />
miles that were within or exceeded 15ºC within each<br />
bull trout patch for 2008, 2040, and 2080 timeframes.<br />
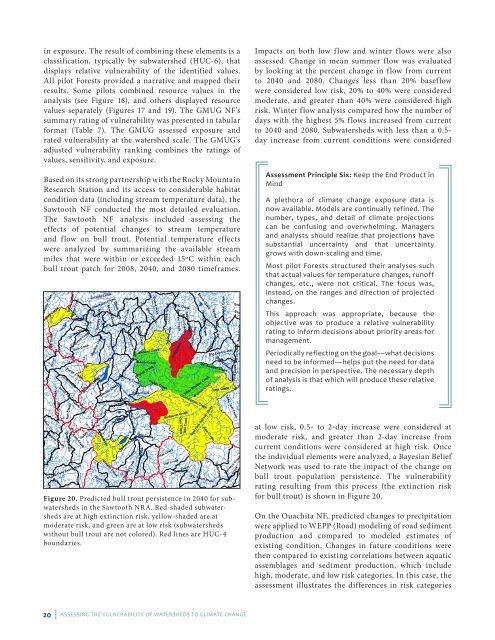
Figure 20. Predicted bull trout persistence in 2040 for subwatersheds<br />
in the Sawtooth NRA. Red-shaded subwatersheds<br />
are at high extinction risk, yellow-shaded are at<br />
moderate risk, and green are at low risk (subwatersheds<br />
with out bull trout are not colored). Red lines are HUC-4<br />
boundaries.<br />
20 | ASSESSING THE VULNERABILITY OF WATERSHEDS TO CLIMATE CHANGE<br />
Impacts on both low flow and winter flows were also<br />
assessed. Change in mean summer flow was evaluated<br />
by looking at the percent change in flow from current<br />
to 2040 and 2080. Changes less than 20% baseflow<br />
were considered low risk, 20% to 40% were considered<br />
moderate, and greater than 40% were considered high<br />
risk. Winter flow analysis compared how the number of<br />
days with the highest 5% flows increased from current<br />
to 2040 and 2080. Subwatersheds with less than a 0.5day<br />
increase from current conditions were considered<br />
Assessment Principle Six: Keep the End Product in<br />
Mind<br />
A plethora of climate change exposure data is<br />
now available. Models are continually refined. The<br />
number, types, and detail of climate projections<br />
can be confusing and overwhelming. Managers<br />
and analysts should realize that projections have<br />
substantial uncertainty and that uncertainty<br />
grows with down-scaling and time.<br />
Most pilot Forests structured their analyses such<br />
that actual values for temperature changes, runoff<br />
changes, etc., were not critical. The focus was,<br />
instead, on the ranges and direction of projected<br />
changes.<br />
This approach was appropriate, because the<br />
objective was to produce a relative vulnerability<br />
rating to inform decisions about priority areas for<br />
management.<br />
Periodically reflecting on the goal—what decisions<br />
need to be informed—helps put the need for data<br />
and precision in perspective. The necessary depth<br />
of analysis is that which will produce these relative<br />
ratings.<br />
at low risk, 0.5- to 2-day increase were considered at<br />
moderate risk, and greater than 2-day increase from<br />
current conditions were considered at high risk. Once<br />
the individual elements were analyzed, a Bayesian Belief<br />
Network was used to rate the impact of the change on<br />
bull trout population persistence. The vulnerability<br />
rating resulting from this process (the extinction risk<br />
for bull trout) is shown in Figure 20.<br />
On the Ouachita NF, predicted changes to precipitation<br />
were applied to WEPP (Road) modeling of road sediment<br />
production and compared to modeled estimates of<br />
existing condition. Changes in future conditions were<br />
then compared to existing correlations between aquatic<br />
assemblages and sediment production, which include<br />
high, moderate, and low risk categories. In this case, the<br />
assessment illustrates the differences in risk categories