

watervulnerability
watervulnerability
watervulnerability

Create successful ePaper yourself
Turn your PDF publications into a flip-book with our unique Google optimized e-Paper software.
Chequamegon-‐Nicolet National Forest Watershed Vulnerability Assessment, Eastern Region (R9)<br />
to show a small increase in precipitation during fall, winter, and spring for northern Wisconsin. This<br />
additional water, available at the time of year when evapotranspiration is low, will most likely go to<br />
satisfying soil moisture deficits and recharging groundwater.<br />
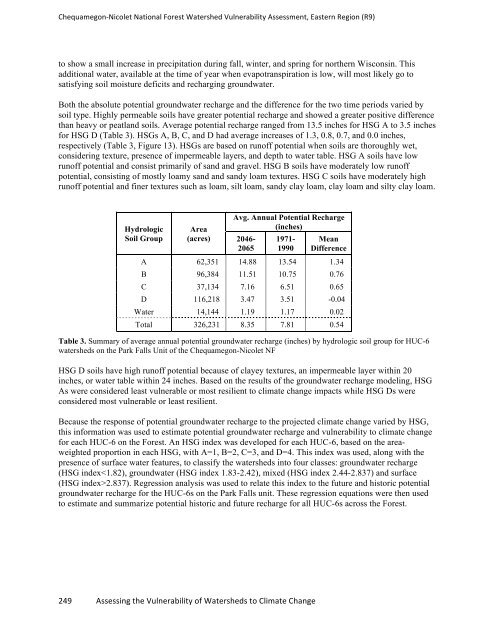
Both the absolute potential groundwater recharge and the difference for the two time periods varied by<br />
soil type. Highly permeable soils have greater potential recharge and showed a greater positive difference<br />
than heavy or peatland soils. Average potential recharge ranged from 13.5 inches for HSG A to 3.5 inches<br />
for HSG D (Table 3). HSGs A, B, C, and D had average increases of 1.3, 0.8, 0.7, and 0.0 inches,<br />
respectively (Table 3, Figure 13). HSGs are based on runoff potential when soils are thoroughly wet,<br />
considering texture, presence of impermeable layers, and depth to water table. HSG A soils have low<br />
runoff potential and consist primarily of sand and gravel. HSG B soils have moderately low runoff<br />
potential, consisting of mostly loamy sand and sandy loam textures. HSG C soils have moderately high<br />
runoff potential and finer textures such as loam, silt loam, sandy clay loam, clay loam and silty clay loam.<br />
Hydrologic<br />
Soil Group<br />
Area<br />
(acres)<br />
Avg. Annual Potential Recharge<br />
(inches)<br />
2046-<br />
2065<br />
1971-<br />
1990<br />
249 Assessing the Vulnerability of Watersheds to Climate Change<br />
Mean<br />
Difference<br />
A 62,351 14.88 13.54 1.34<br />
B 96,384 11.51 10.75 0.76<br />
C 37,134 7.16 6.51 0.65<br />
D 116,218 3.47 3.51 -0.04<br />
Water 14,144 1.19 1.17 0.02<br />
Total 326,231 8.35 7.81 0.54<br />
Table 3. Summary of average annual potential groundwater recharge (inches) by hydrologic soil group for HUC-6<br />
watersheds on the Park Falls Unit of the Chequamegon-Nicolet NF<br />
HSG D soils have high runoff potential because of clayey textures, an impermeable layer within 20<br />
inches, or water table within 24 inches. Based on the results of the groundwater recharge modeling, HSG<br />
As were considered least vulnerable or most resilient to climate change impacts while HSG Ds were<br />
considered most vulnerable or least resilient.<br />
Because the response of potential groundwater recharge to the projected climate change varied by HSG,<br />
this information was used to estimate potential groundwater recharge and vulnerability to climate change<br />
for each HUC-6 on the Forest. An HSG index was developed for each HUC-6, based on the areaweighted<br />
proportion in each HSG, with A=1, B=2, C=3, and D=4. This index was used, along with the<br />
presence of surface water features, to classify the watersheds into four classes: groundwater recharge<br />
(HSG index2.837). Regression analysis was used to relate this index to the future and historic potential<br />
groundwater recharge for the HUC-6s on the Park Falls unit. These regression equations were then used<br />
to estimate and summarize potential historic and future recharge for all HUC-6s across the Forest.