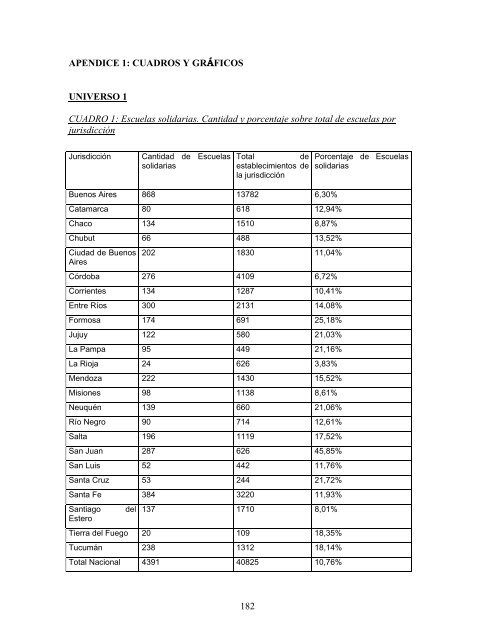
APENDICE 1: CUADROS Y GRÁFICOS UNIVERSO 1 CUADRO 1: Escuelas solidarias. Cantidad y porcentaje sobre total de escuelas por jurisdicción Jurisdicción Cantidad de Escuelas solidarias Total de establecimientos de la jurisdicción Buenos Aires 868 13782 6,30% Catamarca 80 618 12,94% Chaco 134 1510 8,87% Chubut 66 488 13,52% Ciudad de Buenos Aires 202 1830 11,04% Córdoba 276 4109 6,72% Corrientes 134 1287 10,41% Entre Ríos 300 2131 14,08% Formosa 174 691 25,18% Jujuy 122 580 21,03% La Pampa 95 449 21,16% La Rioja 24 626 3,83% Mendoza 222 1430 15,52% Misiones 98 1138 8,61% Neuquén 139 660 21,06% Río Negro 90 714 12,61% Salta 196 1119 17,52% San Juan 287 626 45,85% San Luis 52 442 11,76% Santa Cruz 53 244 21,72% Santa Fe 384 3220 11,93% Santiago del Estero 137 1710 8,01% Tierra del Fuego 20 109 18,35% Tucumán 238 1312 18,14% Total Nacional 4391 40825 10,76% 182 Porcentaje de Escuelas solidarias
CUADRO 2: Escuelas solidarias. Cantidad y porcentaje sobre total de escuelas por jurisdicción, discriminando presentación al Premio Presidencial (PP) 2000 y 2001 Jurisdicción Cantid ad de escuel as PP 2000 Buenos Aires Porcentaj e sobre el total de estableci mientos PP2000 Cantida d de escuela s PP2001 Porcent aje sobre el total de establec imientos PP2001 Total 19 Cantida d de escuela s PP 2000 Y 2001 Porcentaje sobre el total de establecimientos PP2000 unión PP2001 Total de estable cimient os 351 2,55% 589 4,27% 868 6,30% 13782 Catamarca 42 6,80% 47 7,61% 80 12,94% 618 Chaco 80 5,30% 76 5,03% 134 8,87% 1510 Chubut 21 4,30% 53 10,86% 66 13,52% 488 Ciudad de Buenos Aires 107 5,85% 114 6,23% 202 11,04% 1830 Córdoba 169 4,11% 143 3,48% 276 6,72% 4109 Corrientes 58 4,51% 84 6,53% 134 10,41% 1287 Entre Ríos 202 9,48% 124 5,82% 300 14,08% 2131 Formosa 112 16,21% 69 9,99% 174 25,18% 691 Jujuy 81 13,97% 57 9,83% 122 21,03% 580 La Pampa 40 8,91% 57 12,69% 95 21,16% 449 La Rioja 6 0,96% 19 3,04% 24 3,83% 626 Mendoza 78 5,45% 148 10,35% 222 15,52% 1430 Misiones 27 2,37% 75 6,59% 98 8,61% 1138 Neuquén 83 12,58% 76 11,52% 139 21,06% 660 Río Negro 23 3,22% 71 9,94% 90 12,61% 714 Salta 103 9,20% 100 8,94% 196 17,52% 1119 San Juan 213 34,03% 99 15,81% 287 45,85% 626 San Luis 42 9,50% 15 3,39% 52 11,76% 442 Santa Cruz 22 9,02% 35 14,34% 53 21,72% 244 Santa Fe 213 6,61% 189 5,87% 384 11,93% 3220 Santiago 34 1,99% 110 6,43% 137 8,01% 1710 19 El Total se refiere a la unión de PP2000 y PP2001. Este número tiene una diferencia respecto a la suma de los dos años porque se restan las escuelas que participaron los dos años (intersección). 183
- Page 1 and 2:
Research Report K-12 Service-Learni
- Page 3 and 4:
INTRODUCCIÓN…………………
- Page 5 and 6:
INTRODUCCIÓN A nivel mundial, el e
- Page 7 and 8:
Este estudio requiere tener en cuen
- Page 9 and 10:
algunas cuestiones vinculadas a la
- Page 11 and 12:
Para el Service-learning Research a
- Page 13 and 14:
En Brasil se utilizan diversos tér
- Page 15 and 16:
• un servicio ofrecido a una comu
- Page 17 and 18:
generalmente voluntaria, y no se ev
- Page 19 and 20:
CUADRO 1: Diferencias entre tres ti
- Page 21 and 22:
camaradería que incluso se prolong
- Page 23 and 24:
De hecho, el primer caso documentad
- Page 25 and 26:
En su significado más generalizado
- Page 27 and 28:
aprendizaje-servicio es que los est
- Page 29 and 30:
• • • • • la capacidad de
- Page 31 and 32:
fundamentos teóricos y metodológi
- Page 33 and 34:
El número de los proyectos present
- Page 35 and 36:
Común y, de los Regímenes Especia
- Page 37 and 38:
- experiencias de cada temática se
- Page 39 and 40:
Perfil Institucional Perfil de las
- Page 41 and 42:
formularios no figuraba en las base
- Page 43 and 44:
como la de enseñar a producir dulc
- Page 45 and 46:
La subtemática constituye un subco
- Page 47 and 48:
E. Salud - E.1.Educación para la s
- Page 49 and 50:
En estos proyectos el tema no se ab
- Page 51 and 52:
“community service” o de “ser
- Page 53 and 54:
de la receta ortodoxa de restricci
- Page 55 and 56:
GRÁFICO 4: EVOLUCIÓN DE LA DEUDA
- Page 57 and 58:
En este contexto de fuerte desigual
- Page 59 and 60:
GRÁFICO 4: POBLACIÓN EN LAS VILLA
- Page 61 and 62:
niños muertos por desnutrición en
- Page 63 and 64:
La Ciudad y la Provincia de Buenos
- Page 65 and 66:
GRÁFICO: DISTRIBUCIÓN DE LAS ESCU
- Page 67 and 68:
La Ley Federal atribuyó al Ministe
- Page 69 and 70:
casos ordenó mantener en el mismo
- Page 71 and 72:
GRÁFICO: ASISTENCIA Y SOBREEDAD EN
- Page 73 and 74:
GRÁFICO: TASA DE ABANDONO ESCOLAR
- Page 75 and 76:
potabilizadora; la escuela albergue
- Page 77 and 78:
Educación de Chile y Venezuela y m
- Page 79 and 80:
CUADRO 2: Escuelas Solidarias. Tota
- Page 81 and 82:
Neuquén 21,06% Río Negro 12,61% S
- Page 83 and 84:
Río Negro 12,61% 0,457 San Juan 45
- Page 85 and 86:
GRÁFICO Nº: PORCENTAJE DE ESCUELA
- Page 87 and 88:
Tierra del Fuego 2 10,00% 10 50,00%
- Page 89 and 90:
CUADRO: Matrícula de las escuelas
- Page 91 and 92:
CUADROS: Escuelas solidarias de ges
- Page 93 and 94:
Jurisdicción Cantidad de Total de
- Page 95 and 96:
Formosa 87 3,00% Jujuy 67 2,31% La
- Page 97 and 98:
CUADRO 2: Experiencias educativas s
- Page 99 and 100:
En cuanto a la distribución geogr
- Page 101 and 102:
GRÁFICO: EXPERIENCIAS EDUCATIVAS S
- Page 103 and 104:
Formosa y San Juan. O sea, provinci
- Page 105 and 106:
CUADRO 10: Experiencias según tem
- Page 107 and 108:
Jujuy 14,93 % La Pampa 21,31 % 7,46
- Page 109 and 110:
Según lo explicado en el Capitulo
- Page 111 and 112:
G3 115 3,97% H1 110 3,80% H2 51 1,7
- Page 113 and 114:
Los resultados muestran coherencia
- Page 115 and 116:
CUADRO 20: Experiencias educativas
- Page 117 and 118:
INF Y COM 72 78 97 117 15 58 14 52
- Page 119 and 120:
corresponde a casi un 3.39 % del to
- Page 121 and 122:
Formosa 17,24% 49,43% 58,62% Jujuy
- Page 123 and 124:
Tucumán 60,64% 6,02% 16,87% 16,47%
- Page 125 and 126:
La tercera fuente de recursos más
- Page 127 and 128:
GRÁFICO: EXPERIENCIAS EDUCATIVAS S
- Page 129 and 130:
Otro de los aspectos analizados fue
- Page 131 and 132:
De aquellas experiencias que indica
- Page 133 and 134:
CUADRO 33: Experiencias de aprendiz
- Page 135 and 136: - En relación al diagnóstico: enc
- Page 137 and 138: CUADRO 38: Experiencias de aprendiz
- Page 139 and 140: CUADRO. Porcentaje de Escuelas Soli
- Page 141 and 142: provincia que más aumentó su part
- Page 143 and 144: Lo que creemos resulta llamativo es
- Page 145 and 146: CUADRO: Porcentaje de escuelas soli
- Page 147 and 148: aumento proporcional de su particip
- Page 149 and 150: De todos modos, habría también ot
- Page 151 and 152: Sin embargo, es necesario señalar
- Page 153 and 154: temática más atendida es Educaci
- Page 155 and 156: Estos resultados son consistentes c
- Page 157 and 158: comunidad no son para nada sencillo
- Page 159 and 160: - En el 84,13 % de las experiencias
- Page 161 and 162: Ya sea que la actividad sea obligat
- Page 163 and 164: A lo largo de estas conclusiones he
- Page 165 and 166: Ministerio de Educación Programa N
- Page 167 and 168: Ministerio de Educación Programa N
- Page 169 and 170: FREIRE, Paulo. (1997) Pedagogía de
- Page 171 and 172: MINISTERIO DE EDUCACION, IDECE (200
- Page 173 and 174: BIBLIOGRAFIA AAVV, Gerencia Social
- Page 175 and 176: DANZIG, R. - SZANTON, P. National s
- Page 177 and 178: FLORES, Susana. El aprendizaje-serv
- Page 179 and 180: KENDALL, J. (Ed.) Combining service
- Page 181 and 182: Programa Nacional Escuela y Comunid
- Page 183 and 184: PAYNE, David A. Evaluating Service-
- Page 185: TAPIA, María Nieves-MALLEA, María
- Page 189 and 190: CUADRO 4: Escuelas solidarias segú
- Page 191 and 192: Tierra del Fuego 14 2 4 20 Tucumán
- Page 193 and 194: Tierra del Fuego 7 2 3 1 0 0 3 Tucu
- Page 195 and 196: CUADRO 10: Experiencias educativas
- Page 197 and 198: Neuquén 22 54 17 2 5 100 Río Negr
- Page 199 and 200: CUADRO 13: Experiencias educativas
- Page 201 and 202: GRÁFICO 4: EXPERIENCIAS EDUCATIVAS
- Page 203 and 204: CUADRO 16: Experiencias educativas
- Page 205 and 206: Neuquén 3 2 3 4 3 3 1 3 1 10 13 10
- Page 207 and 208: GRÁFICO 5: EXPERIENCIAS EDUCATIVAS
- Page 209 and 210: Neuquén 25 44 54 Río Negro 17 35
- Page 211 and 212: CUADRO 20: Experiencias educativas
- Page 213 and 214: GRÁFICO 9: EXPERIENCIAS EDUCATIVAS
- Page 215 and 216: CUADRO 24: Experiencias de aprendiz
- Page 217: CUADRO 28: Experiencias de aprendiz