Hacia un Diagnóstico de la Vivienda Popular - HDRNet
Hacia un Diagnóstico de la Vivienda Popular - HDRNet
Hacia un Diagnóstico de la Vivienda Popular - HDRNet

You also want an ePaper? Increase the reach of your titles
YUMPU automatically turns print PDFs into web optimized ePapers that Google loves.
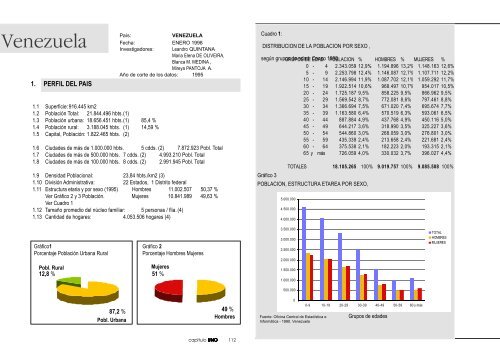
Venezue<strong>la</strong>1. PERFIL DEL PAIS1.1 Superficie: 916.445 km21.2 Pob<strong>la</strong>ción Total: 21.844.496 hbts.(1)1.3 Pob<strong>la</strong>ción urbana: 18.656.451 hbts.(1) 85,4 %1.4 Pob<strong>la</strong>ción rural: 3.188.045 hbts. (1) 14,59 %1.5 Capital, Pob<strong>la</strong>ción: 1.822.465 hbts. (2)País:VENEZUELAFecha: ENERO 1998Investigadores: Leandro QUINTANAMaria Elena DE OLIVEIRA,B<strong>la</strong>nca M. MEDINA ,Mireya PANTOJA A.Año <strong>de</strong> corte <strong>de</strong> los datos: 19951.6 Ciuda<strong>de</strong>s <strong>de</strong> más <strong>de</strong> 1.000.000 hbts. 5 cdds. (2) 7.872.923 Pobl. Total1.7 Ciuda<strong>de</strong>s <strong>de</strong> más <strong>de</strong> 500.000 hbts. 7 cdds. (2) 4.993.210 Pobl. Total1.8 Ciuda<strong>de</strong>s <strong>de</strong> más <strong>de</strong> 100.000 hbts. 8 cdds. (2) 2.991.945 Pobl. Total1.9 Densidad Pob<strong>la</strong>cional: 23,84 hbts./km2 (3)1.10 División Administrativa: 22 Estados, 1 Distrito fe<strong>de</strong>ral1.11 Estructura etaria y por sexo (1995) Hombres 11.002.507 50,37 %Ver Gráfico 2 y 3 Pob<strong>la</strong>ción. Mujeres 10.841.989 49,63 %Ver Cuadro 11.12 Tamaño promedio <strong>de</strong>l núcleo familiar: 5 personas / flia. (4)1.13 Cantidad <strong>de</strong> hogares: 4.053.506 hogares (4)Cuadro 1:DISTRIBUCION DE LA POBLACION POR SEXO ,según grupos GRUPOS <strong>de</strong> edad- DE EDAD Censo 1990 POBLACION % HOMBRES % MUJERES %0 - 4 2.343.059 12,9% 1.194.896 13,2% 1.148.163 12,6%5 - 9 2.253.798 12,4% 1.146.087 12,7% 1.107.711 12,2%10 - 14 2.146.994 11,9% 1.087.702 12,1% 1.059.292 11,7%15 - 19 1.922.514 10,6% 968.497 10,7% 954.017 10,5%20 - 24 1.725.187 9,5% 858.225 9,5% 866.962 9,5%25 - 29 1.569.542 8,7% 772.081 8,6% 797.461 8,8%30 - 34 1.366.694 7,5% 671.020 7,4% 695.674 7,7%35 - 39 1.163.580 6,4% 570.519 6,3% 593.061 6,5%40 - 44 887.884 4,9% 437.768 4,9% 450.116 5,0%45 - 49 644.217 3,6% 318.990 3,5% 325.227 3,6%50 - 54 544.860 3,0% 268.059 3,0% 276.801 3,0%55 - 59 435.339 2,4% 213.658 2,4% 221.681 2,4%60 - 64 375.538 2,1% 182.223 2,0% 193.315 2,1%65 y más 726.059 4,0% 330.032 3,7% 396.027 4,4%TOTALES 18.105.265 100% 9.019.757 100% 9.085.508 100%Gráfico 3POBLACION, ESTRUCTURA ETAREA POR SEXO,5.000.0004.500.0004.000.000Gráfico1Porcentaje Pob<strong>la</strong>ción Urbana RuralPobl. Rural12,8 %Gráfico 2Porcentaje Hombres MujeresMujeres51 %3.500.0003.000.0002.500.0002.000.0001.500.0001.000.000TOTALHOMBRESMUJERES500.00087,2 %Pobl. Urbana49 %HombresFuente: Oficina Central <strong>de</strong> Estadística eInformática - 1990. Venezue<strong>la</strong>00-9 10-19 20-29 30-39 40-49 50-59 60 y másGrupos <strong>de</strong> eda<strong>de</strong>scapítulo UNO 112