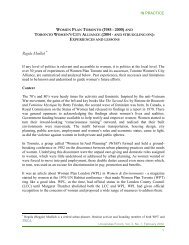
Cuadro MHogares y <strong>Vivienda</strong>,alre<strong>de</strong>dor <strong>de</strong> los años noventaCuadro NSituación Habitacional,alre<strong>de</strong>dor <strong>de</strong> los años noventa.AMÉRICA LATINA Y EL CARIBE (19 PAÍSES)Año Hogares <strong>Vivienda</strong>s <strong>Vivienda</strong>s % <strong>Vivienda</strong>s % <strong>Vivienda</strong>s %( 19 países ) Estimados particu<strong>la</strong>res a<strong>de</strong>cuadas irrecuperables recuperablesSur <strong>de</strong>l continente1 ARGENTINA 1.991 9.380.204 8.554.695 6.434.209 75,20 624.274 7,30 1.496.212 17,502 URUGUAY 1.985 902.300 823.253 685.934 83,30 40.998 5,00 104.553 12,703 PARAGUAY 1.992 873.694 855.547 517.578 60,50 143.080 16,70 194.889 22,804 BRASIL 1.991 35 517 542 34.734.715 19.490.609 56,10 5.098.394 14,70 10.145.712 29,205 CHILE 1.992 3 365 462 3120967 2394995 76,70 364.760 11,70 361.212 11,606 PERU 1.993 4762779 4427517 2231469 50,40 872.221 19,70 1.323.828 29,907 BOLIVIA 1.992 1 614 995 1614995 880172 54,50 406.979 25,20 327.844 20,308 ECUADOR 1.990 2 136 889 2008665 1375212 68,50 296.609 14,80 336.834 16,809 COLOMBIA 1.985 5 824 857 5251273 3303051 62,90 525.127 10,00 1.423.095 27,1010 VENEZUELA 1.990 3750940 3517229 2672168 76,00 529.702 15,10 315.359 9,00El Caribe, México y Centroamerica11 COSTA RICA 1.984 527 299 500030 339840 68,00 43.804 8,80 116.386 23,3012 CUBA 1.981 2 350 221 2290176 1698649 74,20 335.427 14,60 256.100 11,2013 EL SALVADOR 1.992 1091728 1049191 508858 48,50 359.873 34,30 180.461 17,2014 HONDURAS 1.988 808 222 762117 481658 63,20 90.921 11,90 189.767 24,9015 R. DOMINICANA 1.993 534827 533247 326991 61,30 6.990 1,30 199.266 37,4016 GUATEMALA 1.994 1591823 1553708 552934 35,60 290.863 18,70 709.911 45,7017 NICARAGUA 1.991 --- 639531 128545 20,10 289.994 45,30 220.992 34,6018 PANAMA 1.990 541704 524284 365650 69,70 86.268 16,50 72.366 13,8019 MEXICO 1.990 17394368 16035233 11382906 71,00 1.964.712 12,30 2.687.615 16,80AMÉRICA LATINA Y EL CARIBE (19 PAÍSES)AñoHogares noafectados% totalhogaresDéficitcuantitativo b/% déficit.TotalDéficitcualitativo c/% déficittotalDéficit totald/( 19 países )Sur <strong>de</strong>l continente1 ARGENTINA 1.991 6.434.209 68,60 1.449.783 49.2 1.496.212 50,80 2.945.9952 URUGUAY 1.985 685.934 76,00 120.045 53.4 104.553 46,60 224.5983 PARAGUAY 1.992 517.578 59,20 161.227 45.3 194.889 54,70 356.1164 BRASIL 1.991 19.490.609 54,90 5.881.221 36.7 10.145.712 63,30 16.026.9335 CHILE 1.992 2.394.995 71,20 609.255 62.8 361 212 37,20 970.4676 PERU 1.993 2.231.469 46,90 1.207.483 47.7 1 323 828 52,30 2.531.3117 BOLIVIA 1.992 880.172 54,50 406.979 55.4 327 844 44,60 734.8238 ECUADOR 1.990 1.375.212 64,40 424.833 55.8 336 834 44,20 761.6679 COLOMBIA 1.985 3.303.051 56,70 1.098.711 43,60 1.423.095 56,40 2.521.80610 VENEZUELA 1.990 2.672.168 71,20 763.413 70,80 315.359 29,20 1.078.772El Caribe, México y Centroamerica11 COSTA RICA 1.984 339.840 64,40 71.073 37,90 116.386 62,10 187.45912 CUBA 1.981 1.698.649 72,30 395.472 60,70 256.100 39,30 651.57213 EL SALVADOR 1.992 508.858 46,60 402.410 69,00 180.461 31,00 582.87114 HONDURAS 1.988 481.658 59,60 137.026 41,90 189.767 58,10 326.79315 R. DOMINICANA 1.993 326.991 61,10 8.570 4,10 199.266 95,90 207.83616 GUATEMALA 1.994 552.934 34,70 328.978 31,70 709.911. 68,30 1.038.88917 NICARAGUA 1.991 128.545 - 289.994 56,80 220.992. 43,20 510.98618 PANAMA 1.990 365.650 67,50 103.688 58,90 72.366. 41,10 176.05419 MEXICO 1.990 11.382.906 65,40 3 323 847 55,30 2 687 615 44,70 6 011 462Fuente:Cuadro 4 A. Serie Medio ambiente y Desarrollo No. 7 CEPAL,Alojar el Desarrollo, Una tarea para los asentamientos humanos,(J.Mac Donald, F. Otava, y otros)a/ Incluye so<strong>la</strong>mente 19 países, los que representan en 1996 el 96%<strong>de</strong> <strong>la</strong> pob<strong>la</strong>ción <strong>de</strong> <strong>la</strong> región.Fuente:Cuadro A-4 <strong>de</strong>l Anexo. Serie Medio ambiente y Desarrollo No. 7. CEPAL, Alojar el Desarrollo, Unatarea para los asentamientos humanos.(J. Mac Donald, F. Otava, y otros)Nota: Porcentaje consi<strong>de</strong>rado <strong>de</strong> <strong>la</strong> pob<strong>la</strong>ción <strong>de</strong> América Latina y el Caribe en 1990: 96.15%a/ Cepal, Alojar el <strong>de</strong>sarrollo: Una tarea para los asentamientos humanos, op. cit.;b/ Deficiencias cuantitativas: número <strong>de</strong> hogares menos número <strong>de</strong> viviendas a<strong>de</strong>cuadas yrecuperables;c/ Deficiencias cualitativas: número <strong>de</strong> viviendas recuperables;d/ Déficit total: <strong>de</strong>ficiencias cuantitativas más cualitativascapítulo UNO 58
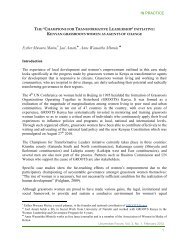
Cuadro ÑPorcentaje <strong>de</strong> <strong>Vivienda</strong>scon serviciosCuadro OIndicadores <strong>de</strong> infraestructuraAGUA BAÑO ELECTRICIDAD COCINA000's% %( 21 países ) TOTAL URBANO RURAL TOTAL URBANO RURAL TOTAL URBANO RURAL TOTAL URBANO RURALTotalSur <strong>de</strong>l continente1 ARGENTINA 92,5 - - - - - - - - - - -2 URUGUAY 82,6 92,3 - 95,9 - - 84,4 - - - - -3 PARAGUAY 25,4 51,8 - - - - 54,1 - - - - -4 BRASIL 57,5 84,2 23,8 41,1 69,9 13,0 55,5 87,0 15,6 75,5 70,4 80,75 CHILE 88,2 97,1 42,4 - - - 88,1 96,3 46,6 - - -6 PERU 33,5 49,1 44,1 60,4 9,1 46,0 46,0 46,0 100,0 100,0 100,07 BOLIVIA - 82,6 - - - - - - - - - -8 ECUADOR 56,5 75,5 31,8 74,2 94,5 47,1 77,7 95,5 53,8 79,1 78,1 80,59 COLOMBIA 70,5 94,5 - - - - 77,1 - - - - -10 VENEZUELA 81,4 87,4 48,7 - - - 93,0 91,8 100,0 - - -El Caribe, México y Centroamerica11 COSTA RICA - - - - - - - - - - - -12 CUBA - - - - - - - - - - - -13 EL SALVADOR - - - - - - - - - - - -14 HONDURAS 66,0 87,2 50,7 58,8 87,8 38,0 39,6 78,5 11,7 74,8 72,2 76,715 R. DOMINICANA - - - - - - - - - - - -16 GUATEMALA - 58,2 - - - - - - - - - -17 NICARAGUA - - - - - - - - - - - -18 PANAMA 80,7 97,4 59,2 88,1 98,4 74,8 72,8 95,6 43,5 - - -19 MEXICO 76,7 - - 74,8 - - 87,5 - - 91,0 - -Penínsu<strong>la</strong> Ibérica20 ESPAÑA 98,7 - - 97,1 - - 99,2 - - - - -21 PORTUGAL 87,2 - - 88,8 - - 97,9 - - - - -AGUABAÑOELECTRICIDADCOCINA000's% %TOTAL URBANO RURAL TOTAL URBANO RURAL TOTAL URBANO RURAL TOTAL URBANO RURAL( 21 países ) (km/1000km5) ( % ) ( % ) TotalSur <strong>de</strong>l continenteCommercial1 ARGENTINA - - - - - - - 12.3 12.3 18.8 63 672 URUGUAY - - - - - - 50.7 16.9 16.8 14.8 23 313 PARAGUAY - - - - - - 72.1 1.1 3.1 6.0 11 234 BRASIL 72 86 31 44 55 3 195.2 3.5 7.5 8.4 25 375 CHILE 85 94 37 - 82 - 104.8 8.7 11.0 9.7 42 496 PERU 60 74 24 44 62 10 54.4 1.7 2.9 3.0 13 187 BOLIVIA 53 78 22 41 58 16 38.6 3.4 3.0 4.4 14 178 ECUADOR 70 82 55 64 87 34 160.1 3.4 5.3 3.8 23 279 COLOMBIA 76 88 48 53 78 33 94.3 1.9 11.3 3.7 29 3610 VENEZUELA - - - - - - - 0.4 9.9 9.3 110 111El Caribe, Mé-ico y Centroamerica11 COSTA RICA 92 86 99 92 85 99 695.9 10.9 11.1 9.8 25 2912 CUBA 93 96 85 66 71 51 - - 3.2 - 33 4513 EL SALVADOR 55 78 37 68 78 59 591.7 26.8 3.2 2.2 15 2714 HONDURAS 66 81 63 65 81 53 126.7 8.9 2.1 3.0 9 1915 R. DOMINICANA 71 74 67 78 76 83 - - 7.4 3.5 19 2216 GUATEMALA - - - - - - 108.8 10.5 2.3 1.8 8 2117 NICARAGUA 61 81 27 31 34 27 117.6 1.7 1.7 1.8 11 2018 PANAMA 83 - - 86 - 27 134.3 6.4 10.2 7.6 35 4219 MEXICO 83 91 62 56 81 25 125.3 13.5 8.8 12.8 60 62Penínsu<strong>la</strong> Ibérica20 ESPAÑA - - - - - - 313.3 25.8 36.4 41.1 88 8921 PORTUGAL - - - - - - 104.4 33.1 31.1 44.3 63 63Fuente:Cuadro 7 . CNUAH.1999Compendium of Human Settlements 1995.Statistical Yearbook Fortieth Issue.Housing in the World Graphical Presentation of Statiscal DataAnnual Bulletin of Transport Statistics for Europe and North America 1992,1993.Statistical Yearbook for Latin America and the Caribbean 1995.Fuente:Cuadro 8.CNUAH.1999The Report on Water Supply and Sanitation coverage provi<strong>de</strong>d by Member States in 1994;Facsimile 6 J<strong>un</strong>e 1996.Water Supply and Sanitation Sector Monitoring Report 1993.Energy Statistical Yearbook 1994.Statistical Yearbook Fortieth Issue.Statistical Yearbook for Latin America and the Caribbean 1995.59 capítulo UNO
- Page 3:
Hacia un Diagnósticode la Vivienda
- Page 8 and 9: ContenidoPresentación 9Introducci
- Page 12 and 13: El Capítulo DOS presenta a través
- Page 14 and 15: capítulo UNO 14
- Page 16 and 17: ArgentinaBoliviaBrasilColombiaCosta
- Page 18: Hacia unDiagnóstico dela Vivienda
- Page 21 and 22: Unidad de Salario Mínimo, Unidad d
- Page 23 and 24: 23 capítulo UNO
- Page 25 and 26: Datos de Población25 capítulo UNO
- Page 27 and 28: Cuadro 2Cantidad de Hogares y Pobla
- Page 29 and 30: En los 21 paísesDensidad Promedio
- Page 31 and 32: Comparativos de población urbana y
- Page 33 and 34: Cuadro 5Rango de Ciudades1.6 1.6 1.
- Page 35 and 36: Viviendas Cooperativas en San Pablo
- Page 37 and 38: Datos de Vivienda37 capítulo UNO
- Page 39 and 40: Cuadro 8 (continuación)Conceptos d
- Page 41 and 42: Déficit HabitacionalCuadro 10Parqu
- Page 43 and 44: Cuadro 13Referencias de Superficie
- Page 45 and 46: Cuadro 15Condiciones para el Crédi
- Page 47 and 48: Costo de Mano de ObraCuadro 17Ofici
- Page 49 and 50: Otros datos de Población y Viviend
- Page 51 and 52: Población, PIB e InflaciónTasa de
- Page 53 and 54: Fuente:Cuadro FCuadro 9 CNUAH.1999W
- Page 55 and 56: Población y Tasa de crecimiento de
- Page 57: Cuadro L( 21 países )Sur del conti
- Page 61 and 62: c a p í t u l oDosDatos por paíse
- Page 63 and 64: tiempo) por cuanto desde el punto d
- Page 65 and 66: Tipos de déficit por arrastre2.21
- Page 67 and 68: 2.18 Déficit por arrastre (Censo)
- Page 69 and 70: Bolivia1. PERFIL DEL PAIS1.1Superfi
- Page 71 and 72: Brasil1. PERFIL DEL PAISPaís: BRAS
- Page 73 and 74: CUADRO V - AREA URBANA - VIVIENDAS
- Page 75 and 76: 2.17 Concepto del déficit en el pa
- Page 77 and 78: 3.3. Planeamiento de uso del suelo
- Page 79 and 80: Supuestos de los censos nacionales2
- Page 81 and 82: CubaPaís:CUBAFecha: JUNIO 1999Inve
- Page 83 and 84: 3. PERFIL INSTITUCIONAL DE LOS SECT
- Page 85 and 86: Chile1. PERFIL DEL PAISPaís:CHILEF
- Page 87 and 88: 2.10 USM es un valor reajustable de
- Page 89 and 90: SECTOR PRIVADO / EMPRESARIALCuadro
- Page 91 and 92: Supuestos de los Censos Nacionales2
- Page 93 and 94: 2. CONFIGURACION DEL SISTEMA HABITA
- Page 95 and 96: Honduras1. PERFIL DEL PAIS1.1 Super
- Page 97 and 98: MexicoPaís:MEXICOFecha: Mayo 1999I
- Page 99 and 100: Cuadro 7COSTO PROMEDIO POR CRÉDITO
- Page 101 and 102: 2.18 Déficit por arrastre (Censo)
- Page 103 and 104: 1009080706050403020101 2.20Deciles
- Page 105 and 106: 2. CONFIGURACION DEL SISTEMA HABITA
- Page 107 and 108: Portugal1. PERFIL DEL PAIS1.1 Super
- Page 109 and 110:
UruguayPaís:URUGUAYFecha: SETIEMBR
- Page 111 and 112:
3. PERFIL INSTITUCIONAL DE LOS SECT
- Page 113 and 114:
2. CONFIGURACION DEL SISTEMA HABITA
- Page 115 and 116:
Cuadro3:EVOLUCION DEL NUMERO DE HOG
- Page 117 and 118:
117 capítulo UNO
- Page 119 and 120:
c a p í t u l oTresAcerca de laviv
- Page 121 and 122:
universales” del Estado (relativa
- Page 123 and 124:
algunos proyectos de ley en estos a
- Page 125 and 126:
media muy extendida, y una constant
- Page 127 and 128:
Cuadro 2HOGARES Y POBLACION SEGUN S
- Page 129 and 130:
transacciones inmobiliarias, buscan
- Page 131 and 132:
ColombiaEVOLUCION DE LA LEGISLACION
- Page 133 and 134:
5. La nueva constitución. 1991.Ley
- Page 135 and 136:
Costa RicaSINOPSIS HISTÓRICA DE LA
- Page 137 and 138:
CubaRESEÑA DE LA EVOLUCION DE LAS
- Page 139 and 140:
evidente ya desde el anterior decen
- Page 141 and 142:
Se continuará además incrementand
- Page 143 and 144:
ChilePOLÍTICAS Y PROGRAMAS HABITAC
- Page 145 and 146:
Operación Sitio (primera etapa de
- Page 147 and 148:
El SalvadorESFUERZOS Y RECURSOS PAR
- Page 149 and 150:
aporta, como donación, ¢ 1500 (US
- Page 151 and 152:
HondurasPROBLEMA DE LOS ASENTAMIENT
- Page 153 and 154:
Así, por ejemplo, la Secretaría d
- Page 155 and 156:
• Desregulación y desgravaciónC
- Page 157 and 158:
MéxicoLA EXPERIENCIA MEXICANAEN LA
- Page 159 and 160:
• Realizar programas de vivienda
- Page 161 and 162:
Fioscer constituye el mayor program
- Page 163 and 164:
ParaguayHACIA UNA POLÍTICA DE VIVI
- Page 165 and 166:
de la Vivienda (1971) y las Socieda
- Page 167 and 168:
PerúNOTAS SOBRE LA POLITICA HABITA
- Page 169 and 170:
CUADRODESTINO VIVIENDAS NUEVAS CONC
- Page 171 and 172:
En lo que se refiere al número de
- Page 173 and 174:
UruguayRESEÑA DE EVOLUCIÓN HISTOR
- Page 175 and 176:
Si bien desde el punto de vista eco
- Page 177 and 178:
1990: Censo Nacional de población
- Page 179 and 180:
c a p í t u l oCuatroDirectorio de
- Page 181 and 182:
El directorio de cada país se orga
- Page 183 and 184:
4.D SECTOR ORGANISMOS NOGUBERNAMENT
- Page 185 and 186:
Intercambio HábitatAño de fundaci
- Page 187 and 188:
Instituto de Pesquisas Tecnológica
- Page 189 and 190:
4.2 GOBIERNOS REGIONALESEste tipo d
- Page 191 and 192:
Asamblea Provincial Poder Popular,P
- Page 193 and 194:
Carretera de Circunvalación, Norte
- Page 195 and 196:
INSTITUCION - COOPERATIVACONAVICOOP
- Page 197 and 198:
El SalvadorSr. Argumedo49a. Av. Sur
- Page 199 and 200:
Col. La Sultana II, Antiguo Cuscatl
- Page 201 and 202:
Añil # 571 4o. Piso, Col. Granjas
- Page 203 and 204:
Instituto de Vivienda del Estado (I
- Page 205 and 206:
ParaguaySecretaría Técnica de Pla
- Page 207 and 208:
(51 1) 475 2841Fax: (51 1) 475 2811
- Page 209 and 210:
4.2 ADMINISTRAÇAO LOCALCâmaras Mu
- Page 211 and 212:
Fax: (598 2) 902 88 05hacerde@adine
- Page 213 and 214:
(582) 014-974.40.47 074-71.08.69/52
- Page 215 and 216:
Instituto para el Desarrollo Social
- Page 217 and 218:
(582) (582) 9792424 / 979.4253 / 97
- Page 219 and 220:
ARGENTINAOrganismosSignatariosdel C
- Page 221 and 222:
PARAGUAYINSTITUTO NACIONAL DE TECNO
- Page 223 and 224:
Instituto de Investigación y Desar
- Page 225 and 226:
Promotora de Vivienda (FUPROVI). Es
- Page 227 and 228:
Referenciasbibliográficas1. El mun
- Page 229:
Octubre, 1999CompiladoraArq. Emma G