Hacia un Diagnóstico de la Vivienda Popular - HDRNet
Hacia un Diagnóstico de la Vivienda Popular - HDRNet
Hacia un Diagnóstico de la Vivienda Popular - HDRNet

Create successful ePaper yourself
Turn your PDF publications into a flip-book with our unique Google optimized e-Paper software.
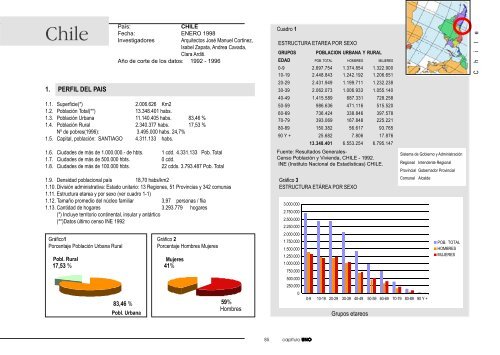
Chile1. PERFIL DEL PAISPaís:CHILEFecha: ENERO 1998InvestigadoresArquitectos José Manuel Cortinez,Isabel Zapata, Andrea Cavada,C<strong>la</strong>ra Arditi.Año <strong>de</strong> corte <strong>de</strong> los datos: 1992 - 19961.1. Superficie(*) 2.006.626 Km21.2. Pob<strong>la</strong>ción Total(**) 13.348.401 habs.1.3. Pob<strong>la</strong>ción Urbana 11.140.405 habs. 83,46 %1.4. Pob<strong>la</strong>ción Rural 2.340.377 habs. 17,53 %Nº <strong>de</strong> pobres(1996): 3.495.000 habs. 24,7%1.5. Capital, pob<strong>la</strong>ción: SANTIAGO 4.311.133 habs.1.6. Ciuda<strong>de</strong>s <strong>de</strong> más <strong>de</strong> 1.000.000.- <strong>de</strong> hbts. 1 cdd. 4.331.133 Pob. Total1.7. Ciuda<strong>de</strong>s <strong>de</strong> más <strong>de</strong> 500.000 hbts. 0 cdd.1.8. Ciuda<strong>de</strong>s <strong>de</strong> más <strong>de</strong> 100.000 hbts. 22 cdds. 3.793.487 Pob. Total1.9. Densidad pob<strong>la</strong>cional país 18,70 habs/km21.10. División administrativa: Estado <strong>un</strong>itario: 13 Regiones, 51 Provincias y 342 com<strong>un</strong>as1.11. Estructura etarea y por sexo (ver cuadro 1-1)1.12. Tamaño promedio <strong>de</strong>l núcleo familiar 3,97 personas / flia1.13. Cantidad <strong>de</strong> hogares 3.293.779 hogares(*) Incluye territorio continental, insu<strong>la</strong>r y antártico(**)Datos último censo INE 1992Gráfico1Porcentaje Pob<strong>la</strong>ción Urbana RuralPobl. Rural17,53 %83,46 %Pobl. UrbanaGráfico 2Porcentaje Hombres MujeresMujeres41%41%59%Hombres59%Cuadro 1ESTRUCTURA ETAREA POR SEXOGRUPOS POBLACION URBANA Y RURALEDAD POB. TOTAL HOMBRES MUJERES0-9 2.697.754 1.374.854 1.322.90010-19 2.448.843 1.242.192 1.206.65120-29 2.431.949 1.199.711 1.232.23830-39 2.062.073 1.006.933 1.055.14040-49 1.415.589 687.331 728.25850-59 986.636 471.116 515.52060-69 736.424 338.846 397.57870-79 393.069 167.848 225.22180-89 150.382 56.617 93.76590 Y + 25.682 7.806 17.87613.348.401 6.553.254 6.795.147Fuente: Resultados Generales-Censo Pob<strong>la</strong>ción y <strong>Vivienda</strong>, CHILE - 1992.INE (Instituto Nacional <strong>de</strong> Estadísticas) CHILE.Gráfico 3ESTRUCTURA ETÁREA POR SEXO3.000.0002.750.0002.500.0002.250.0002.000.0001.750.0001.500.0001.250.0001.000.000750.000500.000250.00000-9 10-19 20-29 30-39 40-49 50-59 60-69 70-79 80-89 90 Y +Grupos etareosSistema <strong>de</strong> Gobierno y AdministraciónRegional Inten<strong>de</strong>nte RegionalProvincial Gobernador ProvincialCom<strong>un</strong>al Alcal<strong>de</strong>POB. TOTALHOMBRESMUJERESC h i l e85 capítulo UNO