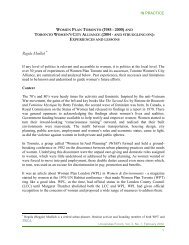
Venezue<strong>la</strong>1. PERFIL DEL PAIS1.1 Superficie: 916.445 km21.2 Pob<strong>la</strong>ción Total: 21.844.496 hbts.(1)1.3 Pob<strong>la</strong>ción urbana: 18.656.451 hbts.(1) 85,4 %1.4 Pob<strong>la</strong>ción rural: 3.188.045 hbts. (1) 14,59 %1.5 Capital, Pob<strong>la</strong>ción: 1.822.465 hbts. (2)País:VENEZUELAFecha: ENERO 1998Investigadores: Leandro QUINTANAMaria Elena DE OLIVEIRA,B<strong>la</strong>nca M. MEDINA ,Mireya PANTOJA A.Año <strong>de</strong> corte <strong>de</strong> los datos: 19951.6 Ciuda<strong>de</strong>s <strong>de</strong> más <strong>de</strong> 1.000.000 hbts. 5 cdds. (2) 7.872.923 Pobl. Total1.7 Ciuda<strong>de</strong>s <strong>de</strong> más <strong>de</strong> 500.000 hbts. 7 cdds. (2) 4.993.210 Pobl. Total1.8 Ciuda<strong>de</strong>s <strong>de</strong> más <strong>de</strong> 100.000 hbts. 8 cdds. (2) 2.991.945 Pobl. Total1.9 Densidad Pob<strong>la</strong>cional: 23,84 hbts./km2 (3)1.10 División Administrativa: 22 Estados, 1 Distrito fe<strong>de</strong>ral1.11 Estructura etaria y por sexo (1995) Hombres 11.002.507 50,37 %Ver Gráfico 2 y 3 Pob<strong>la</strong>ción. Mujeres 10.841.989 49,63 %Ver Cuadro 11.12 Tamaño promedio <strong>de</strong>l núcleo familiar: 5 personas / flia. (4)1.13 Cantidad <strong>de</strong> hogares: 4.053.506 hogares (4)Cuadro 1:DISTRIBUCION DE LA POBLACION POR SEXO ,según grupos GRUPOS <strong>de</strong> edad- DE EDAD Censo 1990 POBLACION % HOMBRES % MUJERES %0 - 4 2.343.059 12,9% 1.194.896 13,2% 1.148.163 12,6%5 - 9 2.253.798 12,4% 1.146.087 12,7% 1.107.711 12,2%10 - 14 2.146.994 11,9% 1.087.702 12,1% 1.059.292 11,7%15 - 19 1.922.514 10,6% 968.497 10,7% 954.017 10,5%20 - 24 1.725.187 9,5% 858.225 9,5% 866.962 9,5%25 - 29 1.569.542 8,7% 772.081 8,6% 797.461 8,8%30 - 34 1.366.694 7,5% 671.020 7,4% 695.674 7,7%35 - 39 1.163.580 6,4% 570.519 6,3% 593.061 6,5%40 - 44 887.884 4,9% 437.768 4,9% 450.116 5,0%45 - 49 644.217 3,6% 318.990 3,5% 325.227 3,6%50 - 54 544.860 3,0% 268.059 3,0% 276.801 3,0%55 - 59 435.339 2,4% 213.658 2,4% 221.681 2,4%60 - 64 375.538 2,1% 182.223 2,0% 193.315 2,1%65 y más 726.059 4,0% 330.032 3,7% 396.027 4,4%TOTALES 18.105.265 100% 9.019.757 100% 9.085.508 100%Gráfico 3POBLACION, ESTRUCTURA ETAREA POR SEXO,5.000.0004.500.0004.000.000Gráfico1Porcentaje Pob<strong>la</strong>ción Urbana RuralPobl. Rural12,8 %Gráfico 2Porcentaje Hombres MujeresMujeres51 %3.500.0003.000.0002.500.0002.000.0001.500.0001.000.000TOTALHOMBRESMUJERES500.00087,2 %Pobl. Urbana49 %HombresFuente: Oficina Central <strong>de</strong> Estadística eInformática - 1990. Venezue<strong>la</strong>00-9 10-19 20-29 30-39 40-49 50-59 60 y másGrupos <strong>de</strong> eda<strong>de</strong>scapítulo UNO 112
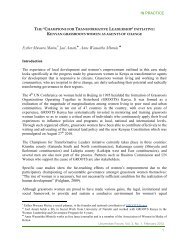
2. CONFIGURACION DEL SISTEMA HABITACIONALDATOS DE POBLACIÓN Y VIVIENDA2.1 Pob<strong>la</strong>ción Económicamente Activa - P.E.A. 8.608.653 Personas (1)MujeresVarones2.2 Pob<strong>la</strong>ción Económicamente Activa Dif.- P.E.A. 2.882.673 5.725.980 personas (1)2.3 Tasa <strong>de</strong> <strong>de</strong>sempleo 10,2 % (1)2.4 PIB por habitante 3.024 U$D (4)2.5 Sa<strong>la</strong>rio Mínimo 226,31 U$D (3) (11)2.6 Canasta familiar mínima (si no coinci<strong>de</strong> con Ingreso Min.) 434 U$D (3)2.7 Ingreso familiar (U$D): Mínimo Medio AltoS/d S/d S/d2.8 Existe <strong>un</strong>a U.S.M. (Unidad <strong>de</strong> Sa<strong>la</strong>rio Mínimo) o simi<strong>la</strong>r (UF) valorizable para compra <strong>de</strong> viviendaValor: 15.000 Bs. (3) 31U$D (9)2.9 USM es <strong>un</strong> valor . Reajuste, Intereses, Otras S/d2.10 Línea <strong>de</strong> pobreza e <strong>de</strong> ingresos por <strong>de</strong>ciles o quintilesVer Cuadro 2 Hogares según Ingresos.2.11 Total Parque <strong>de</strong> viviendas 4.104.503 <strong>Vivienda</strong>s (2)2.12 <strong>Vivienda</strong>s Urbanas: 3.395.074 <strong>Vivienda</strong>s (2) 83 %2.13 <strong>Vivienda</strong>s Rurales: 709.429 <strong>Vivienda</strong>s (2) 17 %2.14 Parque Público S/d2.15 Parque privado S/d2.16 Parque Otros Organismos: S/d2.17 Concepto <strong>de</strong>l déficit en el paísEn Venezue<strong>la</strong> se <strong>de</strong>finen dos tipos <strong>de</strong> DéficitDéficit Estructural:Constituído por aquel<strong>la</strong>s viviendas que presentan problemas graves en su estructura (pare<strong>de</strong>s,piso y techo), <strong>la</strong>s cuales son calificadas como inaceptables.Déficit F<strong>un</strong>cional:Constituído por aquel<strong>la</strong>s viviendas necesarias para alojar a <strong>la</strong>s familias complementarias yaquellos grupos <strong>de</strong> personas que conforman núcleos no familiares.Ministerio <strong>de</strong> Desarrollo Urbano, Consejo Nacional2.18 Déficit por arrastre (Censo) 459.157 <strong>Vivienda</strong>s Déficit Estructural (2)2.19 Déficit por formación <strong>de</strong> nuevos hogares 420.926 <strong>Vivienda</strong>s Déficit F<strong>un</strong>cional (2)2.20 Demanda no cubierta por oferta formal (públ. y privada) S/dTipos <strong>de</strong> déficit por arrastreCalidad física Pared Piso Techo2.21 Nº <strong>de</strong> viviendas(2) 485.828 381.637 49.460 54.731Servicios Agua Energía Desagües2.22 Nº <strong>de</strong> viviendas (2) 684.878 350.830 175.620 158.428Hacinamiento Monoambient. Dos Ambient. Más amb.2.23 Nº <strong>de</strong> viviendas (2) 794.862 292.718 301.663 200.4812.24 Estimación <strong>de</strong> años <strong>de</strong> vida útil S/dSupuestos <strong>de</strong> los Censos Nacionales2.26 Total <strong>Vivienda</strong>s <strong>de</strong>ficitarias: 880.083 viviendas 1990 año (2)2.28 Costo <strong>de</strong> viviendas nuevas Mínimo Medio Alto11.899 27.516 118.989 U$D2.29 Superficie ofertada promedio 35 70 140 m2 (6)2.30 Costo <strong>de</strong> construcción por m2 Mínimo Medio Alto116 139 S/d U$D (7)2.31 Costo <strong>de</strong> alquiler Mínimo Medio AltoS/d S/d S/d U$D/mesCréditos para <strong>la</strong> vivienda2.32 P<strong>la</strong>zos hasta 20 años2.33 Garantía Hipotecaria2.34 Monto promedio <strong>de</strong> cuotas S/d2.35 Reajustes S/d2.37 Re<strong>la</strong>ción Costo Cuotas / Porcentaje <strong>de</strong> los Ingresos Mínimo Medio Alto (<strong>Vivienda</strong> <strong>de</strong>interés social) S/d S/d S/dNOTAS(1) Información <strong>de</strong> <strong>la</strong> Oficina Central <strong>de</strong> Estadistica e Informática <strong>de</strong>l año 1.995(2) Información <strong>de</strong> <strong>la</strong> Oficina Central <strong>de</strong> Estadistica e Informática <strong>de</strong>l año 1.990(3) Información <strong>de</strong> <strong>la</strong> Oficina Central <strong>de</strong> Estadistica e Informática <strong>de</strong>l año 1.996(4) Estimaciones <strong>de</strong>l Banco Interamericano <strong>de</strong> Desarrollo (Dó<strong>la</strong>res <strong>de</strong> 1.990)(5) Información <strong>de</strong> <strong>la</strong> Oficina Central <strong>de</strong> Estadistica e Informática <strong>de</strong>l año 1.997(6) Correspon<strong>de</strong> a los topes <strong>de</strong> precios <strong>de</strong> <strong>la</strong>s soluciones Habitacionales <strong>de</strong> <strong>la</strong> Ley <strong>de</strong> Política Habitacional año 1.997(7) Se refiere al tipo <strong>de</strong> <strong>Vivienda</strong> Unifamiliar tradicional (año 1.997)(8) Se refiere al tipo <strong>de</strong> <strong>Vivienda</strong> T<strong>un</strong>el Pareada (año 1.997)(9) No se incluyen los Bonos Compensatorios Decretados por el Gobierno Nacional que ascien<strong>de</strong>n a 76 U$S(10) Se contemp<strong>la</strong> en <strong>la</strong> Ley <strong>de</strong> Plítica Habitacional <strong>un</strong> Ahorro Obligatorio constituido por <strong>un</strong> aporte <strong>de</strong>l trabajadorequivalente al 1% <strong>de</strong> su sueldo más <strong>un</strong> Aporte Patronal igual al 2% <strong>de</strong>l sueldo <strong>de</strong>l trabajador.(11)Se refiere al Ingreso Familiar Medio.113 capítulo UNO
- Page 3:
Hacia un Diagnósticode la Vivienda
- Page 8 and 9:
ContenidoPresentación 9Introducci
- Page 12 and 13:
El Capítulo DOS presenta a través
- Page 14 and 15:
capítulo UNO 14
- Page 16 and 17:
ArgentinaBoliviaBrasilColombiaCosta
- Page 18:
Hacia unDiagnóstico dela Vivienda
- Page 21 and 22:
Unidad de Salario Mínimo, Unidad d
- Page 23 and 24:
23 capítulo UNO
- Page 25 and 26:
Datos de Población25 capítulo UNO
- Page 27 and 28:
Cuadro 2Cantidad de Hogares y Pobla
- Page 29 and 30:
En los 21 paísesDensidad Promedio
- Page 31 and 32:
Comparativos de población urbana y
- Page 33 and 34:
Cuadro 5Rango de Ciudades1.6 1.6 1.
- Page 35 and 36:
Viviendas Cooperativas en San Pablo
- Page 37 and 38:
Datos de Vivienda37 capítulo UNO
- Page 39 and 40:
Cuadro 8 (continuación)Conceptos d
- Page 41 and 42:
Déficit HabitacionalCuadro 10Parqu
- Page 43 and 44:
Cuadro 13Referencias de Superficie
- Page 45 and 46:
Cuadro 15Condiciones para el Crédi
- Page 47 and 48:
Costo de Mano de ObraCuadro 17Ofici
- Page 49 and 50:
Otros datos de Población y Viviend
- Page 51 and 52:
Población, PIB e InflaciónTasa de
- Page 53 and 54:
Fuente:Cuadro FCuadro 9 CNUAH.1999W
- Page 55 and 56:
Población y Tasa de crecimiento de
- Page 57 and 58:
Cuadro L( 21 países )Sur del conti
- Page 59 and 60:
Cuadro ÑPorcentaje de Viviendascon
- Page 61 and 62: c a p í t u l oDosDatos por paíse
- Page 63 and 64: tiempo) por cuanto desde el punto d
- Page 65 and 66: Tipos de déficit por arrastre2.21
- Page 67 and 68: 2.18 Déficit por arrastre (Censo)
- Page 69 and 70: Bolivia1. PERFIL DEL PAIS1.1Superfi
- Page 71 and 72: Brasil1. PERFIL DEL PAISPaís: BRAS
- Page 73 and 74: CUADRO V - AREA URBANA - VIVIENDAS
- Page 75 and 76: 2.17 Concepto del déficit en el pa
- Page 77 and 78: 3.3. Planeamiento de uso del suelo
- Page 79 and 80: Supuestos de los censos nacionales2
- Page 81 and 82: CubaPaís:CUBAFecha: JUNIO 1999Inve
- Page 83 and 84: 3. PERFIL INSTITUCIONAL DE LOS SECT
- Page 85 and 86: Chile1. PERFIL DEL PAISPaís:CHILEF
- Page 87 and 88: 2.10 USM es un valor reajustable de
- Page 89 and 90: SECTOR PRIVADO / EMPRESARIALCuadro
- Page 91 and 92: Supuestos de los Censos Nacionales2
- Page 93 and 94: 2. CONFIGURACION DEL SISTEMA HABITA
- Page 95 and 96: Honduras1. PERFIL DEL PAIS1.1 Super
- Page 97 and 98: MexicoPaís:MEXICOFecha: Mayo 1999I
- Page 99 and 100: Cuadro 7COSTO PROMEDIO POR CRÉDITO
- Page 101 and 102: 2.18 Déficit por arrastre (Censo)
- Page 103 and 104: 1009080706050403020101 2.20Deciles
- Page 105 and 106: 2. CONFIGURACION DEL SISTEMA HABITA
- Page 107 and 108: Portugal1. PERFIL DEL PAIS1.1 Super
- Page 109 and 110: UruguayPaís:URUGUAYFecha: SETIEMBR
- Page 111: 3. PERFIL INSTITUCIONAL DE LOS SECT
- Page 115 and 116: Cuadro3:EVOLUCION DEL NUMERO DE HOG
- Page 117 and 118: 117 capítulo UNO
- Page 119 and 120: c a p í t u l oTresAcerca de laviv
- Page 121 and 122: universales” del Estado (relativa
- Page 123 and 124: algunos proyectos de ley en estos a
- Page 125 and 126: media muy extendida, y una constant
- Page 127 and 128: Cuadro 2HOGARES Y POBLACION SEGUN S
- Page 129 and 130: transacciones inmobiliarias, buscan
- Page 131 and 132: ColombiaEVOLUCION DE LA LEGISLACION
- Page 133 and 134: 5. La nueva constitución. 1991.Ley
- Page 135 and 136: Costa RicaSINOPSIS HISTÓRICA DE LA
- Page 137 and 138: CubaRESEÑA DE LA EVOLUCION DE LAS
- Page 139 and 140: evidente ya desde el anterior decen
- Page 141 and 142: Se continuará además incrementand
- Page 143 and 144: ChilePOLÍTICAS Y PROGRAMAS HABITAC
- Page 145 and 146: Operación Sitio (primera etapa de
- Page 147 and 148: El SalvadorESFUERZOS Y RECURSOS PAR
- Page 149 and 150: aporta, como donación, ¢ 1500 (US
- Page 151 and 152: HondurasPROBLEMA DE LOS ASENTAMIENT
- Page 153 and 154: Así, por ejemplo, la Secretaría d
- Page 155 and 156: • Desregulación y desgravaciónC
- Page 157 and 158: MéxicoLA EXPERIENCIA MEXICANAEN LA
- Page 159 and 160: • Realizar programas de vivienda
- Page 161 and 162: Fioscer constituye el mayor program
- Page 163 and 164:
ParaguayHACIA UNA POLÍTICA DE VIVI
- Page 165 and 166:
de la Vivienda (1971) y las Socieda
- Page 167 and 168:
PerúNOTAS SOBRE LA POLITICA HABITA
- Page 169 and 170:
CUADRODESTINO VIVIENDAS NUEVAS CONC
- Page 171 and 172:
En lo que se refiere al número de
- Page 173 and 174:
UruguayRESEÑA DE EVOLUCIÓN HISTOR
- Page 175 and 176:
Si bien desde el punto de vista eco
- Page 177 and 178:
1990: Censo Nacional de población
- Page 179 and 180:
c a p í t u l oCuatroDirectorio de
- Page 181 and 182:
El directorio de cada país se orga
- Page 183 and 184:
4.D SECTOR ORGANISMOS NOGUBERNAMENT
- Page 185 and 186:
Intercambio HábitatAño de fundaci
- Page 187 and 188:
Instituto de Pesquisas Tecnológica
- Page 189 and 190:
4.2 GOBIERNOS REGIONALESEste tipo d
- Page 191 and 192:
Asamblea Provincial Poder Popular,P
- Page 193 and 194:
Carretera de Circunvalación, Norte
- Page 195 and 196:
INSTITUCION - COOPERATIVACONAVICOOP
- Page 197 and 198:
El SalvadorSr. Argumedo49a. Av. Sur
- Page 199 and 200:
Col. La Sultana II, Antiguo Cuscatl
- Page 201 and 202:
Añil # 571 4o. Piso, Col. Granjas
- Page 203 and 204:
Instituto de Vivienda del Estado (I
- Page 205 and 206:
ParaguaySecretaría Técnica de Pla
- Page 207 and 208:
(51 1) 475 2841Fax: (51 1) 475 2811
- Page 209 and 210:
4.2 ADMINISTRAÇAO LOCALCâmaras Mu
- Page 211 and 212:
Fax: (598 2) 902 88 05hacerde@adine
- Page 213 and 214:
(582) 014-974.40.47 074-71.08.69/52
- Page 215 and 216:
Instituto para el Desarrollo Social
- Page 217 and 218:
(582) (582) 9792424 / 979.4253 / 97
- Page 219 and 220:
ARGENTINAOrganismosSignatariosdel C
- Page 221 and 222:
PARAGUAYINSTITUTO NACIONAL DE TECNO
- Page 223 and 224:
Instituto de Investigación y Desar
- Page 225 and 226:
Promotora de Vivienda (FUPROVI). Es
- Page 227 and 228:
Referenciasbibliográficas1. El mun
- Page 229:
Octubre, 1999CompiladoraArq. Emma G