
Create successful ePaper yourself
Turn your PDF publications into a flip-book with our unique Google optimized e-Paper software.
260 Ahmet ŞAHAN<br />
When the figures in table 1 are examined, a small amount of difference is observed<br />
between the arithmetic means of the groups’ pretest scores in the academic achievement<br />
test, the communicative competence test, and in the scales of critical thinking,<br />
motivation, attitudes toward learning English, and the students’ attitudes toward each<br />
other. The Independent Samples t test was used to check whether the differences in the<br />
test and scales are statistically significant. The results of the Independent Samples t test<br />
show that the arithmetic means of the groups’ pretest scores in the academic<br />
achievement test, communicative competence test, and in the scales of critical thinking,<br />
motivation, attitudes toward learning English, and the students’ attitudes toward each<br />
other are not statistically significant. P>0,05. Therefore, the groups can be said to be<br />
equal in terms of the variables examined in the research before the practical training.<br />
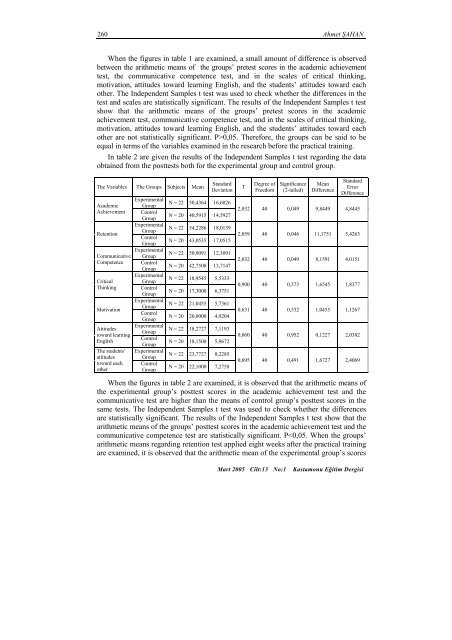
In table 2 are given the results of the Independent Samples t test regarding the data<br />
obtained from the posttests both for the experimental group and control group.<br />
The Variables The Groups Subjects Mean<br />
Academic<br />
Achievement<br />
Retention<br />
Communicative<br />
Competence<br />
Critical<br />
Thinking<br />
Motivation<br />
Attitudes<br />
toward learning<br />
English<br />
The students’<br />
attitudes<br />
toward each<br />
other<br />
Experimental<br />
Group<br />
Control<br />
Group<br />
Experimental<br />
Group<br />
Control<br />
Group<br />
Experimental<br />
Group<br />
Control<br />
Group<br />
Experimental<br />
Group<br />
Control<br />
Group<br />
Experimental<br />
Group<br />
Control<br />
Group<br />
Experimental<br />
Group<br />
Control<br />
Group<br />
Experimental<br />
Group<br />
Control<br />
Group<br />
Standard<br />
Deviation<br />
N = 22 50,4364 16,6026<br />
N = 20 40,5915 14,5927<br />
N = 22 54,2286 18,0<strong>13</strong>9<br />
N = 20 43,0535 17,0515<br />
N = 22 50,9091 12,3091<br />
N = 20 42,7500 <strong>13</strong>,7147<br />
N = 22 18,9545 5,5333<br />
N = 20 17,3000 6,3751<br />
N = 22 21,0455 5,7361<br />
N = 20 20,0000 4,9204<br />
N = 22 18,2727 7,1193<br />
N = 20 18,1500 5,9672<br />
N = 22 23,7727 8,2285<br />
N = 20 22,1000 7,2758<br />
T<br />
Degree of<br />
Freedom<br />
Significance<br />
(2-tailed)<br />
Mean<br />
Difference<br />
Standard<br />
Error<br />
Difference<br />
2,032 40 0,049 9,8449 4,8445<br />
2,059 40 0,046 11,1751 5,4263<br />
2,032 40 0,049 8,1591 4,0151<br />
0,900 40 0,373 1,6545 1,8377<br />
0,631 40 0,532 1,0455 1,1267<br />
0,060 40 0,952 0,1227 2,0382<br />
0,695 40 0,491 1,6727 2,4069<br />
When the figures in table 2 are examined, it is observed that the arithmetic means of<br />
the experimental group’s posttest scores in the academic achievement test and the<br />
communicative test are higher than the means of control group’s posttest scores in the<br />
same tests. The Independent Samples t test was used to check whether the differences<br />
are statistically significant. The results of the Independent Samples t test show that the<br />
arithmetic means of the groups’ posttest scores in the academic achievement test and the<br />
communicative competence test are statistically significant. P