Report of the Local Government Efficiency Review Group
Report of the Local Government Efficiency Review Group
Report of the Local Government Efficiency Review Group

You also want an ePaper? Increase the reach of your titles
YUMPU automatically turns print PDFs into web optimized ePapers that Google loves.
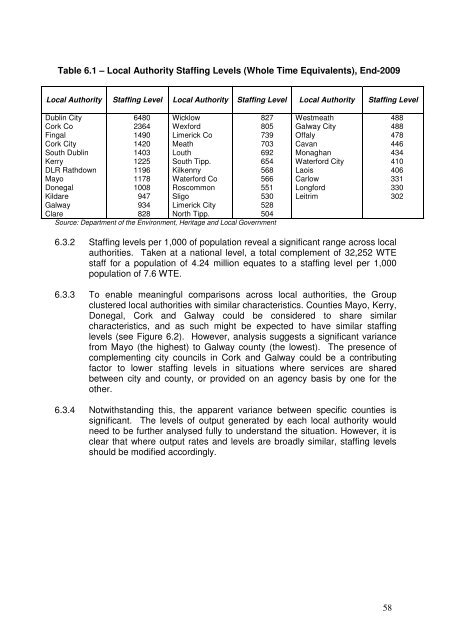
Table 6.1 – <strong>Local</strong> Authority Staffing Levels (Whole Time Equivalents), End-2009<br />
<strong>Local</strong> Authority<br />
Dublin City<br />
Cork Co<br />
Fingal<br />
Cork City<br />
South Dublin<br />
Kerry<br />
DLR Rathdown<br />
Mayo<br />
Donegal<br />
Kildare<br />
Galway<br />
Clare<br />
Staffing Level<br />
6480<br />
2364<br />
1490<br />
1420<br />
1403<br />
1225<br />
1196<br />
1178<br />
1008<br />
947<br />
934<br />
828<br />
<strong>Local</strong> Authority<br />
Wicklow<br />
Wexford<br />
Limerick Co<br />
Meath<br />
Louth<br />
South Tipp.<br />
Kilkenny<br />
Waterford Co<br />
Roscommon<br />
Sligo<br />
Limerick City<br />
North Tipp.<br />
Staffing Level<br />
827<br />
805<br />
739<br />
703<br />
692<br />
654<br />
568<br />
566<br />
551<br />
530<br />
528<br />
504<br />
Source: Department <strong>of</strong> <strong>the</strong> Environment, Heritage and <strong>Local</strong> <strong>Government</strong><br />
<strong>Local</strong> Authority<br />
Westmeath<br />
Galway City<br />
Offaly<br />
Cavan<br />
Monaghan<br />
Waterford City<br />
Laois<br />
Carlow<br />
Longford<br />
Leitrim<br />
Staffing Level<br />
6.3.2 Staffing levels per 1,000 <strong>of</strong> population reveal a significant range across local<br />
authorities. Taken at a national level, a total complement <strong>of</strong> 32,252 WTE<br />
staff for a population <strong>of</strong> 4.24 million equates to a staffing level per 1,000<br />
population <strong>of</strong> 7.6 WTE.<br />
6.3.3 To enable meaningful comparisons across local authorities, <strong>the</strong> <strong>Group</strong><br />
clustered local authorities with similar characteristics. Counties Mayo, Kerry,<br />
Donegal, Cork and Galway could be considered to share similar<br />
characteristics, and as such might be expected to have similar staffing<br />
levels (see Figure 6.2). However, analysis suggests a significant variance<br />
from Mayo (<strong>the</strong> highest) to Galway county (<strong>the</strong> lowest). The presence <strong>of</strong><br />
complementing city councils in Cork and Galway could be a contributing<br />
factor to lower staffing levels in situations where services are shared<br />
between city and county, or provided on an agency basis by one for <strong>the</strong><br />
o<strong>the</strong>r.<br />
6.3.4 Notwithstanding this, <strong>the</strong> apparent variance between specific counties is<br />
significant. The levels <strong>of</strong> output generated by each local authority would<br />
need to be fur<strong>the</strong>r analysed fully to understand <strong>the</strong> situation. However, it is<br />
clear that where output rates and levels are broadly similar, staffing levels<br />
should be modified accordingly.<br />
58<br />
488<br />
488<br />
478<br />
446<br />
434<br />
410<br />
406<br />
331<br />
330<br />
302