- Page 1 and 2:
Organised Crime & Crime Prevention
- Page 3 and 4:
Rådsmedlemmer: Flemming Balvig, Da
- Page 5:
ISBN 87-987103-0-3
- Page 8 and 9:
NSfK’s 40. forskerseminar, Espoo,
- Page 10 and 11:
NSfK’s 40. forskerseminar, Espoo,
- Page 12 and 13:
NSfK’s 40. forskerseminar, Espoo,
- Page 14 and 15:
NSfK’s 40. forskerseminar, Espoo,
- Page 16 and 17:
NSfK’s 40. forskerseminar, Espoo,
- Page 18 and 19:
NSfK’s 40. forskerseminar, Espoo,
- Page 20 and 21:
NSfK’s 40. forskerseminar, Espoo,
- Page 22 and 23:
NSfK’s 40. forskerseminar, Espoo,
- Page 24 and 25:
NSfK’s 40. forskerseminar, Espoo,
- Page 26 and 27:
NSfK’s 40. forskerseminar, Espoo,
- Page 28 and 29: NSfK’s 40. forskerseminar, Espoo,
- Page 30 and 31: NSfK’s 40. forskerseminar, Espoo,
- Page 32 and 33: NSfK’s 40. forskerseminar, Espoo,
- Page 34 and 35: NSfK’s 40. forskerseminar, Espoo,
- Page 36 and 37: NSfK’s 40. forskerseminar, Espoo,
- Page 38 and 39: NSfK’s 40. forskerseminar, Espoo,
- Page 40 and 41: NSfK’s 40. forskerseminar, Espoo,
- Page 42 and 43: NSfK’s 40. forskerseminar, Espoo,
- Page 44 and 45: NSfK’s 40. forskerseminar, Espoo,
- Page 46 and 47: NSfK’s 40. forskerseminar, Espoo,
- Page 48 and 49: NSfK’s 40. forskerseminar, Espoo,
- Page 50 and 51: NSfK’s 40. forskerseminar, Espoo,
- Page 52 and 53: NSfK’s 40. forskerseminar, Espoo,
- Page 54 and 55: NSfK’s 40. forskerseminar, Espoo,
- Page 56 and 57: NSfK’s 40. forskerseminar, Espoo,
- Page 58 and 59: NSfK’s 40. forskerseminar, Espoo,
- Page 60 and 61: NSfK’s 40. forskerseminar, Espoo,
- Page 62 and 63: NSfK’s 40. forskerseminar, Espoo,
- Page 64 and 65: NSfK’s 40. forskerseminar, Espoo,
- Page 66 and 67: NSfK’s 40. forskerseminar, Espoo,
- Page 68 and 69: NSfK’s 40. forskerseminar, Espoo,
- Page 70 and 71: NSfK’s 40. forskerseminar, Espoo,
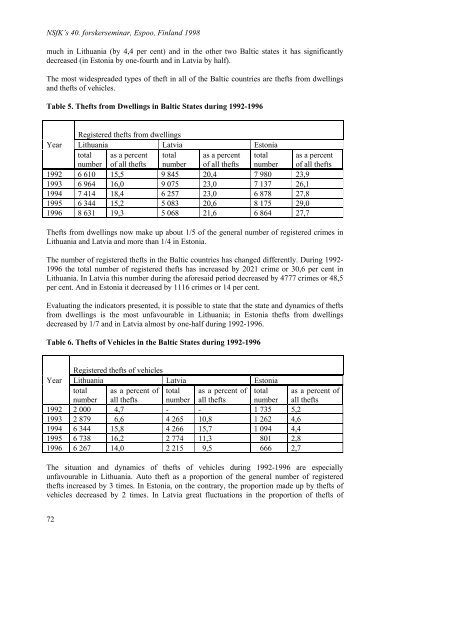
- Page 72 and 73: NSfK’s 40. forskerseminar, Espoo,
- Page 74 and 75: NSfK’s 40. forskerseminar, Espoo,
- Page 76 and 77: NSfK’s 40. forskerseminar, Espoo,
- Page 80 and 81: NSfK’s 40. forskerseminar, Espoo,
- Page 82 and 83: NSfK’s 40. forskerseminar, Espoo,
- Page 84 and 85: NSfK’s 40. forskerseminar, Espoo,
- Page 86 and 87: NSfK’s 40. forskerseminar, Espoo,
- Page 88 and 89: NSfK’s 40. forskerseminar, Espoo,
- Page 90 and 91: NSfK’s 40. forskerseminar, Espoo,
- Page 92 and 93: NSfK’s 40. forskerseminar, Espoo,
- Page 94 and 95: NSfK’s 40. forskerseminar, Espoo,
- Page 96 and 97: NSfK’s 40. forskerseminar, Espoo,
- Page 98 and 99: NSfK’s 40. forskerseminar, Espoo,
- Page 100 and 101: NSfK’s 40. forskerseminar, Espoo,
- Page 102 and 103: NSfK’s 40. forskerseminar, Espoo,
- Page 104 and 105: NSfK’s 40. forskerseminar, Espoo,
- Page 106 and 107: NSfK’s 40. forskerseminar, Espoo,
- Page 108 and 109: NSfK’s 40. forskerseminar, Espoo,
- Page 110 and 111: NSfK’s 40. forskerseminar, Espoo,
- Page 112 and 113: NSfK’s 40. forskerseminar, Espoo,
- Page 114 and 115: NSfK’s 40. forskerseminar, Espoo,
- Page 116 and 117: NSfK’s 40. forskerseminar, Espoo,
- Page 118 and 119: NSfK’s 40. forskerseminar, Espoo,
- Page 120 and 121: NSfK’s 40. forskerseminar, Espoo,
- Page 122 and 123: NSfK’s 40. forskerseminar, Espoo,
- Page 124 and 125: NSfK’s 40. forskerseminar, Espoo,
- Page 126 and 127: NSfK’s 40. forskerseminar, Espoo,
- Page 128 and 129:
NSfK’s 40. forskerseminar, Espoo,
- Page 130 and 131:
NSfK’s 40. forskerseminar, Espoo,
- Page 132 and 133:
NSfK’s 40. forskerseminar, Espoo,
- Page 134 and 135:
NSfK’s 40. forskerseminar, Espoo,
- Page 136 and 137:
NSfK’s 40. forskerseminar, Espoo,
- Page 138 and 139:
NSfK’s 40. forskerseminar, Espoo,
- Page 140 and 141:
NSfK’s 40. forskerseminar, Espoo,
- Page 142 and 143:
NSfK’s 40. forskerseminar, Espoo,
- Page 144 and 145:
NSfK’s 40. forskerseminar, Espoo,
- Page 146 and 147:
NSfK’s 40. forskerseminar, Espoo,
- Page 148 and 149:
NSfK’s 40. forskerseminar, Espoo,
- Page 150 and 151:
NSfK’s 40. forskerseminar, Espoo,
- Page 152 and 153:
NSfK’s 40. forskerseminar, Espoo,
- Page 154 and 155:
NSfK’s 40. forskerseminar, Espoo,
- Page 156 and 157:
NSfK’s 40. forskerseminar, Espoo,
- Page 158 and 159:
NSfK’s 40. forskerseminar, Espoo,
- Page 160 and 161:
NSfK’s 40. forskerseminar, Espoo,
- Page 162 and 163:
NSfK’s 40. forskerseminar, Espoo,
- Page 164 and 165:
NSfK’s 40. forskerseminar, Espoo,
- Page 166 and 167:
NSfK´s 40. forskerseminar, Espoo,
- Page 168 and 169:
NSfK´s 40. forskerseminar, Espoo,
- Page 170 and 171:
NSfK´s 40. forskerseminar, Espoo,
- Page 172 and 173:
NSfK´s 40. forskerseminar, Espoo,
- Page 174 and 175:
NSfK´s 40. forskerseminar, Espoo,
- Page 176 and 177:
NSfK´s 40. forskerseminar, Espoo,
- Page 178 and 179:
NSfK´s 40. forskerseminar, Espoo,
- Page 180 and 181:
NSfK´s 40. forskerseminar, Espoo,
- Page 182 and 183:
NSfK´s 40. forskerseminar, Espoo,
- Page 184 and 185:
NSfK´s 40. forskerseminar, Espoo,
- Page 186 and 187:
NSfK´s 40. forskerseminar, Espoo,
- Page 188 and 189:
NSfK´s 40. forskerseminar, Espoo,
- Page 190 and 191:
NSfK´s 40. forskerseminar, Espoo,
- Page 192 and 193:
NSfK´s 40. forskerseminar, Espoo,
- Page 194 and 195:
NSfK´s 40. forskerseminar, Espoo,
- Page 196 and 197:
NSfK´s 40. forskerseminar, Espoo,
- Page 198 and 199:
NSfK´s 40. forskerseminar, Espoo,
- Page 200 and 201:
NSfK´s 40. forskerseminar, Espoo,
- Page 202 and 203:
NSfK´s 40. forskerseminar, Espoo,
- Page 204 and 205:
NSfK´s 40. forskerseminar, Espoo,
- Page 206 and 207:
NSfK´s 40. forskerseminar, Espoo,
- Page 208 and 209:
NSfK´s 40. forskerseminar, Espoo,
- Page 210 and 211:
NSfK´s 40. forskerseminar, Espoo,
- Page 212 and 213:
NSfK´s 40. forskerseminar, Espoo,
- Page 214 and 215:
NSfK´s 40. forskerseminar, Espoo,
- Page 216 and 217:
NSfK´s 40. forskerseminar, Espoo,
- Page 218 and 219:
NSfK´s 40. forskerseminar, Espoo,
- Page 220 and 221:
NSfK´s 40. forskerseminar, Espoo,
- Page 222 and 223:
NSfK´s 40. forskerseminar, Espoo,
- Page 224 and 225:
NSfK´s 40. forskerseminar, Espoo,
- Page 226 and 227:
NSfK´s 40. forskerseminar, Espoo,
- Page 228 and 229:
NSfK´s 40. forskerseminar, Espoo,
- Page 230 and 231:
NSfK´s 40. forskerseminar, Espoo,
- Page 232 and 233:
NSfK´s 40. forskerseminar, Espoo,
- Page 234 and 235:
NSfK´s 40. forskerseminar, Espoo,
- Page 236 and 237:
NSfK´s 40. forskerseminar, Espoo,
- Page 238 and 239:
NSfK´s 40. forskerseminar, Espoo,
- Page 240 and 241:
NSfK´s 40. forskerseminar, Espoo,
- Page 242 and 243:
NSfK´s 40. forskerseminar, Espoo,
- Page 244 and 245:
NSfK´s 40. forskerseminar, Espoo,
- Page 246 and 247:
NSfK´s 40. forskerseminar, Espoo,
- Page 248 and 249:
NSfK´s 40. forskerseminar, Espoo,
- Page 250 and 251:
NSfK´s 40. forskerseminar, Espoo,
- Page 252 and 253:
NSfK´s 40. forskerseminar, Espoo,
- Page 254 and 255:
NSfK´s 40. forskerseminar, Espoo,
- Page 256 and 257:
NSfK´s 40. forskerseminar, Espoo,
- Page 258 and 259:
NSfK´s 40. forskerseminar, Espoo,
- Page 260 and 261:
NSfK´s 40. forskerseminar, Espoo,
- Page 262 and 263:
NSfK´s 40. forskerseminar, Espoo,
- Page 264 and 265:
NSfK´s 40. forskerseminar, Espoo,
- Page 266 and 267:
NSfK´s 40. forskerseminar, Espoo,
- Page 268 and 269:
NSfK´s 40. forskerseminar, Espoo,
- Page 270 and 271:
NSfK´s 40. forskerseminar, Espoo,
- Page 272:
NSfK´s 40. forskerseminar, Espoo,


