EQUALITY GUIdE - KU Leuven
EQUALITY GUIdE - KU Leuven
EQUALITY GUIdE - KU Leuven

You also want an ePaper? Increase the reach of your titles
YUMPU automatically turns print PDFs into web optimized ePapers that Google loves.
48 Equality Guide<br />
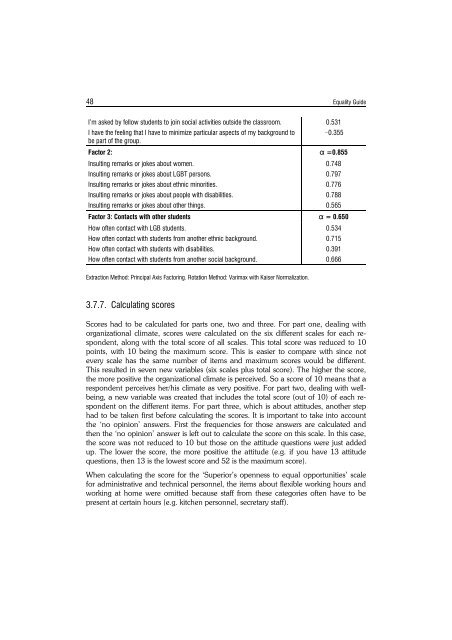
I’m asked by fellow students to join social activities outside the classroom. 0.531<br />
I have the feeling that I have to minimize particular aspects of my background to &0.355<br />
be part of the group.<br />
Factor 2: " =0.855<br />
Insulting remarks or jokes about women. 0.748<br />
Insulting remarks or jokes about LGBT persons. 0.797<br />
Insulting remarks or jokes about ethnic minorities. 0.776<br />
Insulting remarks or jokes about people with disabilities. 0.788<br />
Insulting remarks or jokes about other things. 0.565<br />
Factor 3: Contacts with other students " = 0.650<br />
How often contact with LGB students. 0.534<br />
How often contact with students from another ethnic background. 0.715<br />
How often contact with students with disabilities. 0.391<br />
How often contact with students from another social background. 0.666<br />
Extraction Method: Principal Axis Factoring. Rotation Method: Varimax with Kaiser Normalization.<br />
3.7.7. Calculating scores<br />
Scores had to be calculated for parts one, two and three. For part one, dealing with<br />
organizational climate, scores were calculated on the six different scales for each respondent,<br />
along with the total score of all scales. This total score was reduced to 10<br />
points, with 10 being the maximum score. This is easier to compare with since not<br />
every scale has the same number of items and maximum scores would be different.<br />
This resulted in seven new variables (six scales plus total score). The higher the score,<br />
the more positive the organizational climate is perceived. So a score of 10 means that a<br />
respondent perceives her/his climate as very positive. For part two, dealing with wellbeing,<br />
a new variable was created that includes the total score (out of 10) of each respondent<br />
on the different items. For part three, which is about attitudes, another step<br />
had to be taken first before calculating the scores. It is important to take into account<br />
the ‘no opinion’ answers. First the frequencies for those answers are calculated and<br />
then the ‘no opinion’ answer is left out to calculate the score on this scale. In this case,<br />
the score was not reduced to 10 but those on the attitude questions were just added<br />
up. The lower the score, the more positive the attitude (e.g. if you have 13 attitude<br />
questions, then 13 is the lowest score and 52 is the maximum score).<br />
When calculating the score for the ‘Superior’s openness to equal opportunities’ scale<br />
for administrative and technical personnel, the items about flexible working hours and<br />
working at home were omitted because staff from these categories often have to be<br />
present at certain hours (e.g. kitchen personnel, secretary staff).