

will government's massive surge in investment ... - Myiris.com
will government's massive surge in investment ... - Myiris.com
will government's massive surge in investment ... - Myiris.com

You also want an ePaper? Increase the reach of your titles
YUMPU automatically turns print PDFs into web optimized ePapers that Google loves.
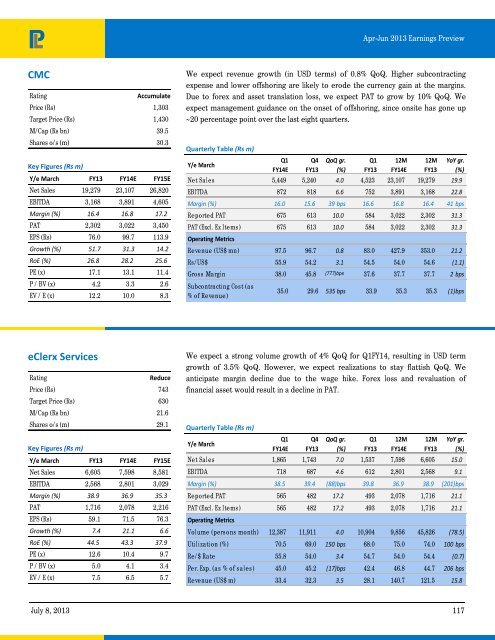
Apr-Jun 2013 Earn<strong>in</strong>gs Preview<br />
CMC<br />
Rat<strong>in</strong>g<br />
Accumulate<br />
Price (Rs) 1,303<br />
Target Price (Rs) 1,430<br />
M/Cap (Rs bn) 39.5<br />
Shares o/s (m) 30.3<br />
Key Figures (Rs m)<br />
Y/e March FY13 FY14E FY15E<br />
Net Sales 19,279 23,107 26,820<br />
EBITDA 3,168 3,891 4,605<br />
Marg<strong>in</strong> (%) 16.4 16.8 17.2<br />
PAT 2,302 3,022 3,450<br />
EPS (Rs) 76.0 99.7 113.9<br />
Growth (%) 51.7 31.3 14.2<br />
RoE (%) 26.8 28.2 25.6<br />
PE (x) 17.1 13.1 11.4<br />
P / BV (x) 4.2 3.3 2.6<br />
EV / E (x) 12.2 10.0 8.3<br />
We expect revenue growth (<strong>in</strong> USD terms) of 0.8% QoQ. Higher subcontract<strong>in</strong>g<br />
expense and lower offshor<strong>in</strong>g are likely to erode the currency ga<strong>in</strong> at the marg<strong>in</strong>s.<br />
Due to forex and asset translation loss, we expect PAT to grow by 10% QoQ. We<br />
expect management guidance on the onset of offshor<strong>in</strong>g, s<strong>in</strong>ce onsite has gone up<br />
~20 percentage po<strong>in</strong>t over the last eight quarters.<br />
Quarterly Table (Rs m)<br />
Y/e March<br />
Q1<br />
FY14E<br />
Q4<br />
FY13<br />
QoQ gr.<br />
(%)<br />
Q1<br />
FY13<br />
12M<br />
FY14E<br />
12M<br />
FY13<br />
YoY gr.<br />
(%)<br />
Net Sales 5,449 5,240 4.0 4,523 23,107 19,279 19.9<br />
EBITDA 872 818 6.6 752 3,891 3,168 22.8<br />
Marg<strong>in</strong> (%) 16.0 15.6 39 bps 16.6 16.8 16.4 41 bps<br />
Reported PAT 675 613 10.0 584 3,022 2,302 31.3<br />
PAT (Excl. Ex Items) 675 613 10.0 584 3,022 2,302 31.3<br />
Operat<strong>in</strong>g Metrics<br />
Revenue (US$ mn) 97.5 96.7 0.8 83.0 427.9 353.0 21.2<br />
Rs/US$ 55.9 54.2 3.1 54.5 54.0 54.6 (1.1)<br />
Gross Marg<strong>in</strong> 38.0 45.8 (777)bps 37.6 37.7 37.7 2bps<br />
Subcontract<strong>in</strong>g Cost (as<br />
% of Revenue)<br />
35.0 29.6 535 bps<br />
33.9 35.3 35.3 (1)bps<br />
eClerx Services<br />
Rat<strong>in</strong>g<br />
Reduce<br />
Price (Rs) 743<br />
Target Price (Rs) 630<br />
M/Cap (Rs bn) 21.6<br />
Shares o/s (m) 29.1<br />
Key Figures (Rs m)<br />
Y/e March FY13 FY14E FY15E<br />
Net Sales 6,605 7,598 8,581<br />
EBITDA 2,568 2,801 3,029<br />
Marg<strong>in</strong> (%) 38.9 36.9 35.3<br />
PAT 1,716 2,078 2,216<br />
EPS (Rs) 59.1 71.5 76.3<br />
Growth (%) 7.4 21.1 6.6<br />
RoE (%) 44.5 43.3 37.9<br />
PE (x) 12.6 10.4 9.7<br />
P / BV (x) 5.0 4.1 3.4<br />
EV / E (x) 7.5 6.5 5.7<br />
We expect a strong volume growth of 4% QoQ for Q1FY14, result<strong>in</strong>g <strong>in</strong> USD term<br />
growth of 3.5% QoQ. However, we expect realizations to stay flattish QoQ. We<br />
anticipate marg<strong>in</strong> decl<strong>in</strong>e due to the wage hike. Forex loss and revaluation of<br />
f<strong>in</strong>ancial asset would result <strong>in</strong> a decl<strong>in</strong>e <strong>in</strong> PAT.<br />
Quarterly Table (Rs m)<br />
Y/e March<br />
Q1<br />
FY14E<br />
Q4<br />
FY13<br />
QoQ gr.<br />
(%)<br />
Q1<br />
FY13<br />
12M<br />
FY14E<br />
12M<br />
FY13<br />
YoY gr.<br />
(%)<br />
Net Sales 1,865 1,743 7.0 1,537 7,598 6,605 15.0<br />
EBITDA 718 687 4.6 612 2,801 2,568 9.1<br />
Marg<strong>in</strong> (%) 38.5 39.4 (88)bps 39.8 36.9 38.9 (201)bps<br />
Reported PAT 565 482 17.2 493 2,078 1,716 21.1<br />
PAT (Excl. Ex Items) 565 482 17.2 493 2,078 1,716 21.1<br />
Operat<strong>in</strong>g Metrics<br />
Volume (persons month) 12,387 11,911 4.0 10,904 9,856 45,826 (78.5)<br />
Utilization (%) 70.5 69.0 150 bps 68.0 75.0 74.0 100 bps<br />
Re/$ Rate 55.8 54.0 3.4 54.7 54.0 54.4 (0.7)<br />
Per. Exp. (as % of sales ) 45.0 45.2 (17)bps 42.4 46.8 44.7 206 bps<br />
Revenue (US$ m) 33.4 32.3 3.5 28.1 140.7 121.5 15.8<br />
July 8, 2013 117


