Apr-Jun 2013 Earn<strong>in</strong>gs Preview FMCG Nifty: Company & Sector Valuations Wgt (%) Mcap (Rs m) No. of Shares (m) CMP (Rs) PAT (Rs m) EPS (Rs) PER (x) 2012 2013 2014 2015 2012 2013 2014 2015 2012 2013 2014 2015 27 H<strong>in</strong>dustan Unilever 3.3% 1,318,459 2,162.5 610 25,726 31,882 34,935 40,292 11.9 14.7 16.2 18.6 51.2 41.4 37.7 32.7 Growth (%) 18.4 23.9 9.6 15.3 18.3 23.9 9.6 15.3 28 ITC 10.2% 2,739,566 7,901.8 347 61,622 74,184 85,312 103,444 7.9 9.5 10.9 13.2 44.0 36.5 31.8 26.2 Growth (%) 23.1 20.4 15.0 21.3 21.9 20.4 15.0 21.3 29 Asian Pa<strong>in</strong>ts 1.1% 448,228 95.9 4,673 10,226 11,137 13,380 16,307 106.6 116.1 139.5 170.0 43.8 40.2 33.5 27.5 Growth (%) 21.3 8.9 20.1 21.9 21.3 8.9 20.1 21.9 Total 14.6% 4,506,253 10,064.3 97,573 117,204 133,627 160,044 46.2 38.4 33.7 28.2 Growth (%) 35.9 20.1 14.0 19.8 Source: Company Data, Bloomberg, PL Research Metals Nifty: Company & Sector Valuations Wgt (%) Mcap (Rs m) No. of Shares (m) CMP (Rs) PAT (Rs m) EPS (Rs) PER (x) 2012 2013 2014 2015 2012 2013 2014 2015 2012 2013 2014 2015 30 H<strong>in</strong>dalco Industries 0.7% 191,745 1,914.6 100 33,970 30,269 26,892 29,142 17.7 15.8 13.6 14.6 5.6 6.3 7.3 6.8 Growth (%) 38.3 (10.9) (11.2) 8.4 38.2 (10.9) (13.8) 7.5 31 J<strong>in</strong>dal Steel & Power 0.5% 207,299 934.8 222 40,585 34,842 29,849 30,816 43.4 37.3 31.9 33.0 5.1 5.9 6.9 6.7 Growth (%) 8.1 (14.2) (14.3) 3.2 8.0 (14.2) (14.3) 3.2 32 Sesa Goa 0.3% 122,543 869.1 141 26,955 22,803 24,329 27,347 31.0 26.2 27.9 32.1 4.5 5.4 5.1 4.4 Growth (%) (36.2) (15.4) 6.7 12.4 (36.9) (15.4) 6.3 15.0 33 Tata Steel 0.9% 252,419 971.2 260 20,279 3,323 24,323 34,528 20.9 3.4 25.0 35.5 12.5 76.0 10.4 7.3 Growth (%) (65.8) (83.6) 632.0 42.0 (66.3) (83.6) 632.0 42.0 34 Coal India 1.0% 1,831,746 6,316.4 290 147,263 179,742 181,030 196,991 23.3 28.5 28.7 31.2 12.4 10.2 10.1 9.3 Growth (%) 35.2 22.1 0.7 8.8 35.2 22.1 0.7 8.8 35 NMDC 0.4% 406,185 3,964.7 102 72,654 61,949 65,172 59,044 18.3 15.6 16.1 14.9 5.6 6.6 6.3 6.9 Growth (%) 11.8 (14.7) 5.2 (9.4) 11.8 (14.9) 3.5 (7.7) Total 3.8% 3,011,938 14,971 341,705 332,928 351,595 377,868 8.8 9.0 8.6 8.0 Growth (%) 1.2 (2.6) 5.6 7.5 Source: Company Data, Bloomberg, PL Research July 8, 2013 182
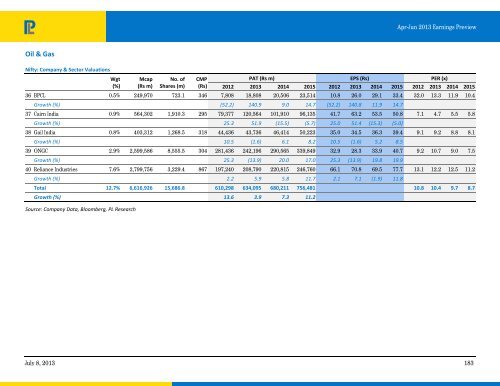
Apr-Jun 2013 Earn<strong>in</strong>gs Preview Oil & Gas Nifty: Company & Sector Valuations Wgt (%) Mcap (Rs m) No. of Shares (m) CMP (Rs) PAT (Rs m) EPS (Rs) PER (x) 2012 2013 2014 2015 2012 2013 2014 2015 2012 2013 2014 2015 36 BPCL 0.5% 249,970 723.1 346 7,808 18,808 20,506 23,514 10.8 26.0 29.1 33.4 32.0 13.3 11.9 10.4 Growth (%) (52.2) 140.9 9.0 14.7 (52.2) 140.8 11.9 14.7 37 Cairn India 0.9% 564,302 1,910.3 295 79,377 120,564 101,910 96,135 41.7 63.2 53.5 50.8 7.1 4.7 5.5 5.8 Growth (%) 25.3 51.9 (15.5) (5.7) 25.0 51.4 (15.3) (5.0) 38 Gail India 0.8% 403,312 1,268.5 318 44,436 43,736 46,414 50,223 35.0 34.5 36.3 39.4 9.1 9.2 8.8 8.1 Growth (%) 10.5 (1.6) 6.1 8.2 10.5 (1.6) 5.2 8.5 39 ONGC 2.9% 2,599,586 8,555.5 304 281,436 242,196 290,565 339,849 32.9 28.3 33.9 40.7 9.2 10.7 9.0 7.5 Growth (%) 25.3 (13.9) 20.0 17.0 25.3 (13.9) 19.8 19.9 40 Reliance Industries 7.6% 2,799,756 3,229.4 867 197,240 208,790 220,815 246,760 66.1 70.8 69.5 77.7 13.1 12.2 12.5 11.2 Growth (%) 2.2 5.9 5.8 11.7 2.1 7.1 (1.9) 11.8 Total 12.7% 6,616,926 15,686.8 610,298 634,095 680,211 756,481 10.8 10.4 9.7 8.7 Growth (%) 13.6 3.9 7.3 11.2 Source: Company Data, Bloomberg, PL Research July 8, 2013 183